Teach Engineering
Searching for Bigfoot and Others Like Him
Individuals create a GIS data layer in Google Earth that displays information about where one might find seven different cryptids. The class members research to find data on cryptid sightings they can include in their data...
Curated OER
Galaxy Hunter - A Cosmic Photo Safari
Space science stars journey through our night sky and take virtual photos of galaxies to investigate simple random samples. Higher math is used to analyze the data collected. Copy the evaluation/assessment questions onto a handout...
Curated OER
Ice Cream
Learners explore the concepts of mean, median, mode, and range as they elicit data about people's favorite flavor of ice cream. A practical application of the data obtained offers an extension to the lesson plan.
Virginia Department of Education
Exponential Modeling
Investigate exponential growth and decay. A set of six activities has pupils collecting and researching data in a variety of situations involving exponential relationships. They model these situations with exponential functions and solve...
Curated OER
Waves
Light waves and sound waves are the focus of this science lesson designed for 5th graders. Besides discovering how these waves travel, learners also discover the basic properties of waves, and analyze data tables and graphs. The...
Curated OER
Courtship and Marriage
Students research the concept of courtship and marriage as it pertains to early New England and explore the values and culture that shaped our history. In this courtship and marriage lesson plan, students examine primary source documents...
Curated OER
Exploring Career Choices
Students complete a self-analysis exercise and choose a career to research based on the results. Students research their career using various resources including interview and internet research. They use the information gathered to...
Baylor College
Body Mass Index (BMI)
How do you calculate your Body Mass Index, and why is this information a valuable indicator of health? Class members discover not only what BMI is and practice calculating it using the height and weight of six fictitious individuals, but...
NASA
Tools to Study Tornadoes and Galaxies
Take your class on an intergalactic journey as they explore the galaxy and various meteorological events taking place in our atmosphere each day. Learners investigate electromagnetic waves and the Doppler Effect before gathering radar...
Curated OER
Speed Challenge
In this science activity, students create a race track and mark each distance as stated. Then they perform each task and record the time it takes them for each. Students also record their data from the experiment into the chart...
Curated OER
Drug and Alcohol Awareness
Fourth graders examine the statistics when it comes to teens and drug and alcohol abuse. In groups, they research the side effects of four different drugs. Using the information, they perform a skit, or puppet show to share their data...
Curated OER
This Land is Our Land
Students interpret NASS data to determine loss or gain of farm land and compare land in production and crop production over a 50 year period.
Kenan Fellows
Using Water Chemistry as an Indicator of Stream Health
Will this water source support life? Small groups test the chemistry of the water drawn from two different sources. They then compare the collected data to acceptable levels to draw conclusions about the health of the source. The...
Curated OER
Tides in the Hudson
Students view an illustration of the Hudson River watershed and identify the bodies of water shown. They discuss what happens when fresh and salt water mix. Students view a teacher demonstration of the stratification of fresh and salt...
University of Connecticut
Building Your Own Biosphere
On September 26, 1991, four women and four men entered the scientific experiment, Biosphere 2; the doors were sealed for two years in order to study the interactions of a biosphere. In the activity, scholars explore biospheres by...
Curated OER
Asthma Survey
Young scholars collect survey data on the prevalence of asthma in a community. They summarize and display the survey data in ways that show meaning.
Curated OER
Numbers Tell a Story
Students connect census data to historical events. In this civics lesson plan, students understand cause and effect, and how they are reflected in census data and analyze census data for social and economic significance.
Curated OER
Oh, What A Day
Students listen as the teacher reads A Country Far Away. They predict what they will do and what they think their partner student will be doing. Students create a KWL chart for Japan. They collect information about their activities on an...
Curated OER
Lesson Plan: The Net Neutrality Debate
Should Internet users who send data-heavy content pay higher fees than those who are involved in activities, like sending an email, that have less content? This question is at the heart of the Net Neutrality debate. After watching a PBS...
Brine Shrimp: Getting to Know a Salt Water Arthropod
Gather small observations of arthropods. Using brine shrimp, pupils observe the life cycle of arthropods. Learners set up saltwater aquariums and observe the brine shrimp over a three-week period. To finish, they compare and contrast how...
101 Questions
Chalk Lines
Read between the lines to find a solution. Budding mathematicians analyze a situation to solve a problem. They view a video presentation of the problem, brainstorm important information to gather, and write linear equations to find...
Curated OER
Charts and Graphs
Fifth graders interpret data into graphs and percentages. In this organizing data lesson, 5th graders discuss bar, circle and line graphs. Students complete bar graph and apply probability using the results.
Curated OER
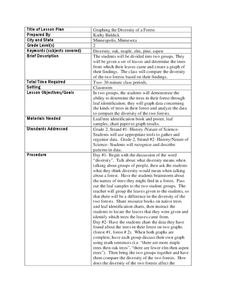
Graphing the Diversity of a Forest
Second graders work in groups to identify what types of trees create which types of leaves In this plant life lesson plan, 2nd graders analyze a set of leaves and identify the tree it came from while graphing the data in a science...
Curated OER
Arthur Young and the President
Students work with NASS data by converting it into prose. In this historical agriculture information lesson, students read about how George Washington communicated information about crop yields, livestock, and land values. They apply the...
Other popular searches
- Data Gathering
- Science Data Gathering
- Data Gathering Strategies
- Gather and Organizing Data
- Gather and Organize Data
- Gathering Qualitative Data
- Data Gathering Tests
- Gathering and Charting Data
- Math Data Gathering
- Math, Data Gathering
- Gather Solar System Data
- Gathering Weather Data


