Curated OER
Discovering the Magical Pi
Students calculate pi using data on the circumference and diameter of various objects. They define key vocabulary terms, measure the circumference and diameter of various circular objects, organize the data on a table or chart, and...
Curated OER
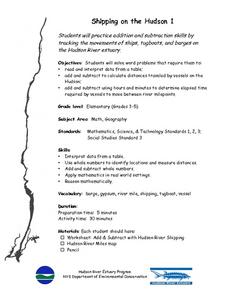
Shipping on the Hudson
Students track movements of ships, tugboats, and barges on the Hudson River estuary in order to practice addition and subtraction skills. They solve word problems by reading and interpreting data from a table. They calculate distances...
Curated OER
Range, Mean, Median and Mode Through the Internet
Students compute measures of central tendency. In this range, mean, median and mode lesson, students gather information on the internet, organize the data and then compute the measures of central tendency. They create a...
Curated OER
Mapping The Ocean Floor
Young scholars explore and analyze the bottom structure of underwater habitats. They describe and explain what can't see through the collection and correlation of accurate data. Learners assess that technology is utilized as a tool for...
Curated OER
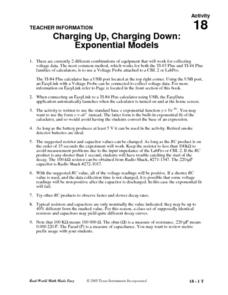
Charging Up, Charging Down
Learners collect and analyze voltage data. Then, they investigate exponential functions using the TI and a Voltage Probe and graph their data and analyze it using a table.
Curated OER
State Economy Chart
Fifth graders research and record statistics on the economy of an assigned state. They create a spreadsheet in Excel to report the data and a 3D Pie graph using the Chart Wizard in Excel to represent their states' data.
Curated OER
Genetic Drift
Students use a mathematical simulation of genetic drift to answer questions about the factors that influence this evolutionary process. They run a series of simulations varying allele frequency and population size and then analyze their...
Curated OER
Comparing the Health and Lifestyles of 13 Year-olds Around the World.
Eighth graders examine international data and statistics to evaluate the health and trends of 13 year old students around the world.
Curated OER
Count The Letters
Students perform activities involving ratios, proportions and percents. Given a newspaper article, groups of students count the number of letters in a given area. They use calculators and data collected to construct a pie chart and bar...
Curated OER
Linear Relationship
Students use a graphing calculator to examine the association between the data points and equation of a linear relationship. They write equations in slope- intercept form. Answer key included.
Curated OER
Linear Relationships - Standard Form
Students use a graphing calculator to examine the association between the data points and equation of a linear relationship. They write equations in standard form and then graph the equations using the slop-intercept form. Answer Key...
Curated OER
Specific Heat of Air and Soil
Young scholars are introduced to the concept of specific heat. In groups, they are given a set of data showing the temperatures of air and soil samples in which they calculate the ranges of the data. They identify whether the air or...
Curated OER
The Bouncing Ball
Learners use the scientific method to conduct an experiment to test how a ball bounces. In this inquiry-based physical science and scientific method activity, students drop a ball from specified heights and record the rebound, then...
Curated OER
Tall Tale Rollers
Students explore American tall tales. In this tall tale lesson, students discover the six characteristics that are included in tall tales. Students survey their class to find each student's favorite tall tale character and organize the...
Curated OER
Lines of Fit
Students solve equations dealing with best fit lines. In this algebra lesson, students solve problems by analyzing data from a scatterplot, and define it as positive, negative or no correlation. They classify slopes the same way as...
Curated OER
Teenage pregnancy trends in Canada
Students analyze demographic data relating to teen pregnancy trends. They develop skills to locate and interpret data. They discuss the factors that influence teenage pregancy such as social, economic, and educational issues.
Curated OER
Let's Keep Track of Grades
Students participate in a technology project. This activity is a hands-on spreadsheet project where students are responsible for keeping track of their grades for class. The students learn to enter data into a spreadsheet, create...
Mathematics TEKS Toolkit
Grade 6: Exploring c/d = pi
Introduce your math class to the perimeter of a circle. Teach them that pi describes the relationship between the circumference and the diameter. As a hands-on investigation, pairs or small groups use string to compare these two values...
Curated OER
Ocean Currents and Sea Surface Temperature
Students use satellite data to explore sea surface temperature. They explore the relationship between the rotation of the Earth, the path of ocean current and air pressure centers. After studying maps of sea surface temperature and ocean...
Curated OER
Analyzing the Job Market for Babysitting in Your Neighborhood
Young scholars conduct research on a neighborhood in Canada. In this data analysis lesson, students use data from the 2006 Canadian census to draw conclusions about a population group.
Curated OER
Global Warming Statistics
Students research and collect data regarding temperature changes for a specific location and find the mean, median, and mode for their data. In this climate change lesson, students choose a location to research and collect data regarding...
Curated OER
Distribution of children living at home
Students use E-STAT to examine demographics. In this social demographics lesson, students use statistical data to determine if a particular family is in need of assistance. Students will discuss social and educational policies and...
Curated OER
Cars on the Curve
Second graders, using two dice, participate in a car race game called Cars on the Curve. They predict which car wins the game and records it in their Data Diary.
Curated OER
Canada and its Trading Partners
Students identify the relationship between Canada and its trading partners. They use two data sources, Canadian Statistics and E-STAT, on the Statistics Canada website to explore the growing importance of trade in general.
Other popular searches
- Data Tables
- Data Displays
- Displaying Data
- Create Data Table
- Data Table and Graph
- Creating Data Tables
- Science Data Tables
- Creating a Data Table
- Making Data Tables
- Organizing Data in Tables
- Solar System Data Table
- Data Tables and Graphing

