Curated OER
Predator-Prey Simulation
Students simulate the interactions between a predator population of lynx and a prey population of rabbits. They collect and graph the data, then extend the graph to predict the populations for several more generations.
Curated OER
Experimenting with Pressure and Volume
Learners investigate temperature and pressure with simple laboratory equipment. They use a handheld with sensors and probes to study temperature and pressure. Students explore the nature of gases with respect to temperature and are able...
Curated OER
Ohio Census 1990 and 2000
Students explore the Ohio census numbers in 1990 and 2000. For this social studies lesson, students use the census data to answer questions.
Curated OER
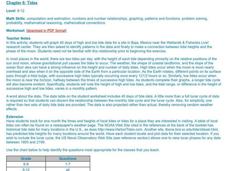
Tides
Learners graph 40 days of high and low tide data for a site in Baja, Mexico near the Wetlands & Fisheries Live! research center. They identify patterns in the data and finally to make a connection between tidal heights and the phase...
Curated OER
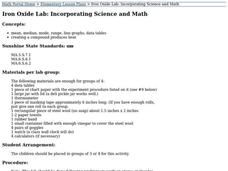
Iron Oxide Lab: Incorporating Math and Science
Students conduct an experiment in small groups, draw conclusions about the amount heat of a compound achieves and practice their data analysis skills.
Curated OER
Radioactive Decay Curve
Students gather and organize data. In this radioactive decay curve lesson, students gather data as they follow the provided procedures for rolling dice. Students chart their data and examine interval results.
Curated OER
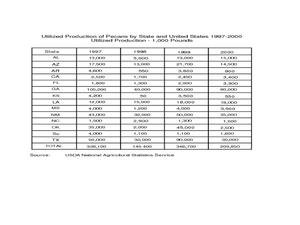
Pecan Power
Students study the origins of pecans and complete a bar graph from the data they have discovered. In this pecan lesson plan, students draw pecans, discuss a pecan time line, and draw a bar graph comparing Arizona pecans to other...
Curated OER
Lesson 3: Life Cycle of Brassica Plants
Students investigate the life cycle of brassica plants. For this science lesson, students observe each stage in the life cycle of their plant. Students record their observations and graph the data. Students
Curated OER
Monitoring Oxygen Level
Students measure oxygen percentages in room air and air exhaled after they perform various activities. They explore various websites, and record and analyze the data from the experiments.
Curated OER
Vacation Matrix-Integrated Core
Students read aloud, "The Best Vacation Ever," by Stuart Murphy locate vacation spots on a map and describe their own vacations. Students illustrate their summer vacation spot and describe the vacation, placing it on a "vacation matrix"...
Curated OER
Plotting the Petroleum Plume
Eighth graders examine the difference between confining layers and aquifers in a basic water table aquifer scenario. They contour groundwater elevation and petroleum product thickness data.
Curated OER
Kansas Foods A Data and Probability Investigation
Students study a number of food products and anticipate which are derived from Kansas crops. They make a list of words associated with the food stuffs and graph the results.
Curated OER
Graphing Current Drug Data
Students increase understanding of the drug issue and further develop skill in graphing.
Curated OER
Chemical Reaction of Carbonate Rocks and Acids
High schoolers complete an investigation into the chemical reaction that occurs between carbonate rocks and acids. Working in groups, students design and conduct their investigation. They create a data table detailing their results. ...
Curated OER
Yaba "Data" Cereal
Fifth graders create and modify a database using information from cereal labels.
Curated OER
Handling Data: Comparing Distributions
Students gather information by analyzing graphs, diagrams and pie charts. In this graphs and diagrams lesson, students complete addition and subtraction problems. Students discuss a pie chart. Students use information to crate a stacked...
Curated OER
Handling Data: Probability
Fourth graders find and justify probabilities and approximations. In this repeating experiment, 4th graders complete a worksheet after rolling die and tossing coins to determine outcomes.
Serendip
Is Yeast Alive?
Through two investigations, life science learners determine whether or not yeast is alive. They perform tests for metabolism by providing sugar and observing if gas is produced as a byproduct. They incubate some of the sample for at...
Virginia Department of Education
Average Atomic Masses
Facilitate learning by using small objects to teach the principles of atomic mass in your science class. Pupils determine the average mass of varying beans as they perform a series of competitive experiments. They gather data and...
Curated OER
Latitude
Your young geologists generate a graph given a table of values from the context of latitude and percent of the earth's surface north of that latitude. The questions in the activity then focus the learners to a deeper understanding of the...
Curated OER
Graphs Galore
Fourth graders conduct surveys to collect data. They analyze and interpret the data, then determine which type of graph is appropriate for the data. Students use the data to make predictions, discover patterns and draw conclusions...
Curated OER
Human Activity and the Environment
Students review and analyze graphs and tables as a group. They develop their graph and data analysis skills by converting data tables from Human Activity and the Environment into graphs.
Curated OER
Get a Half Life!
Eighth graders use M&M's to experiment with data. They use a graphing calculator to determine the best equation for their data; linear, quadratic or exponential. They analyze the data to find the half-life of their M&M's.
Curated OER
How does Your Province Stack Up?
Learners investigate data about age, and sex of a population. For this statistics lesson, students are given data on a population to analyze and compare to other provinces. This assignment is part of a geography lesson and requires 3...
Other popular searches
- Data Tables
- Data Displays
- Displaying Data
- Create Data Table
- Data Table and Graph
- Creating Data Tables
- Science Data Tables
- Creating a Data Table
- Making Data Tables
- Organizing Data in Tables
- Solar System Data Table
- Data Tables and Graphing


