Desmos
Desmos Graphing Calculator
They say a graph is worth a thousand points. The interactive allows users to graph a wide variety of functions and equations. Using the included keyboard or typing directly into the list, learners determine the graph of a function....
CK-12 Foundation
Frequency Tables to Organize and Display Data: Favorite Films
What information can your class determine if they know the number of people attending movie showings? Using the information about the number of people at each screening, learners develop a frequency table. The pupils analyze the type of...
CK-12 Foundation
Bar Graphs, Frequency Tables, and Histograms: Comparing Heights
Become a master at creating visual displays. Using a provided list of heights, users of the interactive create a bar graph and a histogram. They answer a set of challenge questions based on these data representations.
Howard Hughes Medical Institute
DNA Sequence Assembly
Oncologists use DNA sequence data to identify specific cancers and offer more targeted treatments. Grasp an understanding of the complexity involved by learning how the body sequences and assembles DNA. Eager scientists explore the...
Shodor Education Foundation
Regression
How good is the fit? Using an interactive, classmates create a scatter plot of bivariate data and fit their own lines of best fit. The applet allows pupils to display the regression line along with the correlation coefficient. As a final...
Curated OER
My Test Book: Reading Graphs
In this online interactive math skills worksheet, students solve 10 multiple choice math problems that require them to read and interpret graphs. Students may view the correct answers.
Physics Classroom
Component Addition
Learn to analyze vector addition on graph paper through multiple levels of practice problems. Pupils begin with two component addition and move through three and four components to prove mastery as one part of a series on vectors and...
Curated OER
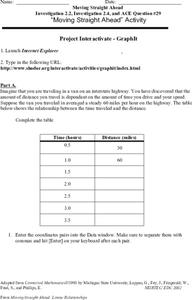
Moving Straight Ahead
In this functions worksheet, 9th graders solve and complete 24 various types of problems. First, they complete the table with the correct distance for each hour given. Then, students enter the coordinate pairs into the function table...
McGraw Hill
Population Biology
The carrying capacity of an environment varies based on the organisms that live there. Using a virtual lab simulation, scholars test two protists living in their own environments and a third environment where both protists live....
PhET
Radioactive Dating Game
Uranium 235 has a half-life of over 700 million years and is the fuel used in the atomic bomb dropped on Hiroshima, Japan. Pupils see the half-lives and decay rates of Carbon-14 and Uranium-238. They also take measurements of these two...
CK-12 Foundation
Frequency Polygons: Constructing a Frequency Polygon
Connect the dots on frequency. Given a distribution table of scores on an assessment, learners create a frequency polygon by moving points on a graph to the correct frequency. The pupils use the display to answer questions about the...
Curated OER
Working with Frequency Tables
In this Working with Frequency Tables activity, students analyze data that is organized in simple frequency charts. They calculate average from data presented in a frequency table, calculate a cumulative score, and identify data...
Curated OER
Air Pollution:What's the Solution?-Weather's Role
In this air pollution and weather activity, students collect data using an online animation to determine the air quality at given times along with the wind speed and temperature in a particular city. Students make 3 bar graphs using the...
Curated OER
Ohm's Law
In this Ohm's Law instructional activity, students answer 16 questions about electricity, electric current, voltage and electricity and they mathematically analyze a circuit they design and construct.
Curated OER
Elbow Room - Exploring Population Density
In this population learning exercise, learners click on the links and research the internet about population, land, and government. Students answer 16 short answer questions including making spreadsheets.
Curated OER
EOCT Practice 1
In this Algebra I worksheet, 9th graders solve practice problems in preparation for the end of course testing. The one page worksheet contains twenty multiple choice questions. Answers are provided.
US Department of Education
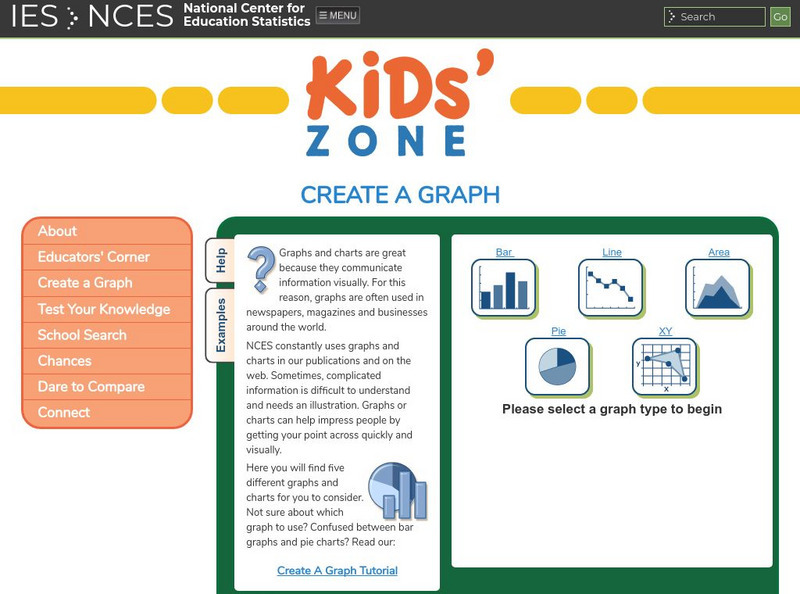
Nces Kids: Create an Xy Graph
This is where you can find a step by step explanation of how to create an XY graph. When you finish each step just click the next tab and you will find the next set of instructions.
US Department of Education
Nces Kids: Creating an Area Graph
This is where you will find step by step directions explaining how to create an area graph. Complete each step and click on the next tab. Directions are simple and clear.
Math Is Fun
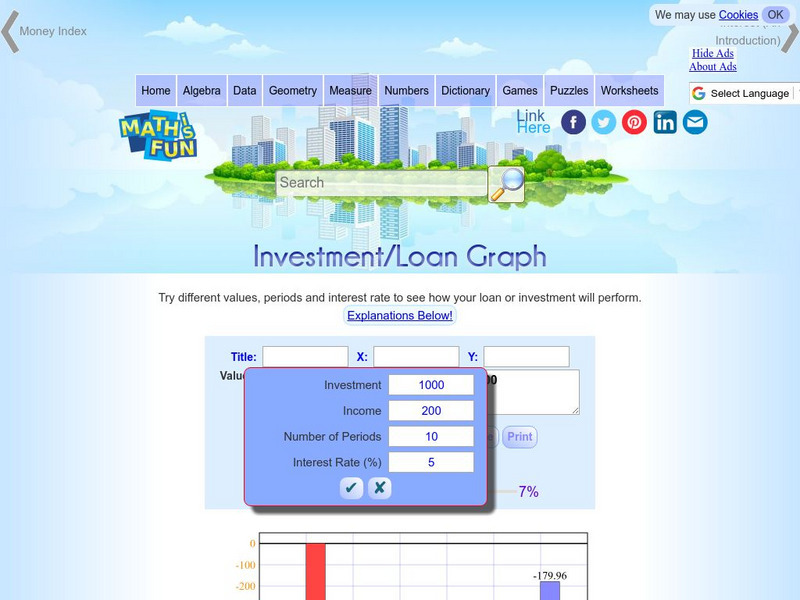
Math Is Fun: Investment/loan Graph
This interactive graph lets you explore how a loan or investment performs in different scenarios. Adjust the present value, the net present value, the loan or investment amount, the length of time, and the interest rate, and see the data...
National Council of Teachers of Mathematics
Nctm: Illuminations: Bar Grapher
Graph data sets in bar graphs.
National Center for Ecological Analysis and Synthesis, University of California Santa Barbara
Nceas: What Are Data?
This site from NCEAS answers many questions about data. You can also learn about data, tables, and types of graphs in this informative site.
Concord Consortium
Concord Consortium: Stem Resources: Relative Humidity Measurement
Using the wet bulb-dry bulb method, students will compare the temperature of a dry temperature sensor and a wet temperature sensor. By comparing the temperatures, students will be able to find the relative humidity. After completing the...


