Howard Hughes Medical Institute
Evolution in Action: Data Analysis
An environmental factor, such as a drought, sometimes speeds up the rate of natural selection. Scholars analyze data on the beaks of birds around the time of the drought. They compare those that survived to those that perished and find...
Fort Bend Independent School District
Data Analysis - AP Statistics
What better way to study survey design than to design your own survey! Bring a versatile data analysis project to your AP Statistics class, and encourage them to apply the practices from their instructions to a real-world survey...
Howard Hughes Medical Institute
Got Lactase? Blood Glucose Data Analysis
Many physicals include a blood glucose test, but what are doctors actually testing? Scholars graph and interpret blood glucose data, allowing them to observe the differences in lactase persistence and draw conclusions. They then connect...
Curated OER
Mathemafish Population
It's shark week! In this problem, young mathematically minded marine biologists need to study the fish population by analyzing data over time. The emphasis is on understanding the average rate of change of the population and drawing...
Howard Hughes Medical Institute
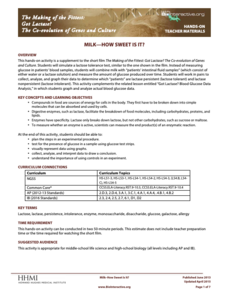
Milk—How Sweet Is It?
Have you ever wondered why some people are lactose intolerant? Participants test simulated patients in a hands-on lab activity to find out! They learn about lactose intolerance by performing an experiment, analyzing data, and drawing...
US Department of Agriculture
Sink or Float?
Will it sink or will it float? Learners predict the outcome as they drop random objects into a container of water. Then, they keep track of the results and record the data in a t-chart to draw a final conclusion.
Las Cumbres Observatory
Plotting an Asteroid Light Curve
Data can tell us a lot about celestial objects that are just too far away to study otherwise. Learners examine data on the brightness of an asteroid to predict its rotation rate. Graphing the data reveals a periodic pattern that allows...
Curated OER
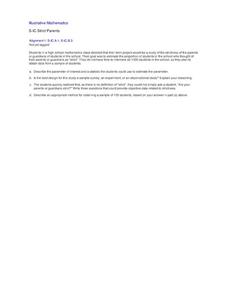
Strict Parents
Are your parents or guardians strict? That's an interesting question many of your pupils are probably interested in discussing. How do you design a study directed at your high schooler to gain insight into that question? How do you...
Curated OER
Reel Projects
Students investigate projectile motion. In this projectile motion lesson, students investigate a website with an interactive lesson. Students view the changes in the projectile they see in the lesson. Students watch short video clips and...
Howard Hughes Medical Institute
Look Who's Coming for Dinner: Selection by Predation
What happens when a new predator comes to town? Learners analyze an experiment that studies the effect of predation on selection. They use real data to draw conclusions about the impact a new predator has on a prey species.
Serendip
The Molecular Biology of Mutations and Muscular Dystrophy
Different types of mutations cause unique types and degrees of muscular dystrophy. Scholars learn about the types of mutations and the impact on the body. They compare the location of the mutations and draw conclusions about how it is...
PBS
Insulation Station
It's all about the material. Learners experiment with different substances as they try to keep an ice cube from melting. They draw conclusions by answering a set of questions about the types and amount of material that had the best result.
US Environmental Protection Agency
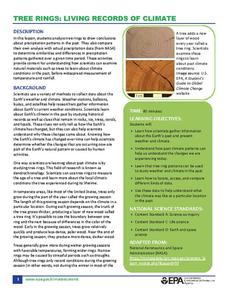
Tree Rings: Living Records of Climate
Open with a discussion on weather and climate and then explain how tree rings can provide scientists with information about the earth's past climate. Pupils analyze graphics of simulated tree rings from various US locations for the...
American Psychological Association
Do Cookies/Donuts Improve Memory? Errors in Methodology
If the methodology is skewed, the results will be skewed. That's the takeaway from an exercise designed to get class members thinking about research methods and statistics gathering. Instructors manipulate the testing environment to...
Howard Hughes Medical Institute
Ocean Acidification
Human impacts on the environment can sometimes be difficult to measure, especially under water! An activity centered on ocean acidification gives science scholars the opportunity to examine the effects of carbon dioxide on marine life....
101 Questions
Representative Sample
At what point does data switch from being an outlier to part of the average? Scholars view conflicting news articles about protesters. They must decide which, if any, side is using the correct sample to draw their conclusions. It's a...
101 Questions
Joulies
Does your coffee get too cold too fast? Joulies just might be your answer! Learners use experimental data to make a conclusion about how effective Joulies are at keeping coffee at the ideal temperature. A video shows the graph of the...
Big Kid Science
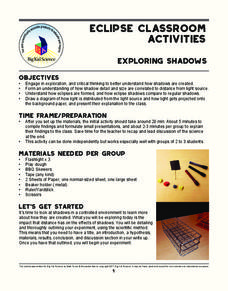
Exploring Shadows
What's that lurking in the shadows? An activity that demonstrates how eclipses happen. Science scholars investigate how light and distance interact to form shadows. The experiment uses simple materials to generate data and observations...
Serendip
Evolution and Adaptations
Survival of the fittest isn't just for the movies! A five-part lesson explores several different species with known adaptations and analyzes them for their survival strategies. Using both video and research data, scholars draw...
NASA
Analyzing Surface Air Temperatures by Latitude: Student Activity
Explore global temperatures from the comfort of your learning place! Meteorologists analyze surface temperatures and anomalies across different latitudes. Investigators evaluate graphs to find temperature differences and answer questions...
PBS
Predicting/Making a Hypothesis
As an introduction to the hypothesis and testing method of investigation, young history detectives engage in a special investigation of a family artifact. After watching a short video that demonstrates the method, they develop a...
Foundation for Water & Energy Education
How is Flowing Water an Energy Source? Activity A
Here is a fun little exploration of the potential energy potential of falling water. Learners drop water from various heights using a straw, and they analyze the diameter of the splash. Pair this with two more activities of the same...
Foundation for Water & Energy Education
How is Flowing Water an Energy Source? Activity B
Explore the world's water without leaving the classroom! In this second of three uncomplicated but wonderful activities, physical science learners feel the pressure of water. They discover that the deeper the water, the stronger the...
NASA
The Effects of Sunspots on Climate
In this sunspots and climate change learning exercise, learners use a diagram of a tree stump and its rings to determine the age of the tree. They use sunspot data from the internet and they construct an Excel spreadsheet to compare the...


