Illustrative Mathematics
Find the Change
This exercise is an opportunity for algebra learners to understand the connection between the slope of a line and points found on the line. Use similar triangles to explain why slope m is the same between any two points. Discuss with the...
101 Questions
The Mystery Line
Take the mystery out of linear functions. Provided an image with no scale, learners guess where the line that connects them might cross the y-axis. After providing the coordinates of the points, they realize scale is an important...
Illustrative Mathematics
Who Has the Best Job?
Making money is important to teenagers. It is up to your apprentices to determine how much two wage earners make with their after school jobs. Participants work with a table, an equation, and a graph and compare the two workers to see...
Curated OER
Do Two Points Always Determine a Linear Function II?
Learners analyze the difference between the slope intercept and standard forms of a line in this task. Given two general points using letters they explore linear functions and linear equations.
Teach Engineering
Matching the Motion
It is not always easy to walk the straight and narrow. In the sixth portion of a nine-part unit, groups actively recreate a graph depicting motion. Individuals walk toward or away from a motion detector while trying to match a given...
Illustrative Mathematics
The Intersection of Two Lines
Here is an introduction to solving simultaneous linear equations. Start by drawing a line through two points. Create a second line which goes through the intersecting point. Background knowledge of how to find the equation of a line and...
US Department of Commerce
Educational Attainment and Marriage Age - Testing a Correlation Coefficient's Significance
Do women with college degrees get married later? Using a provided scatter plot of the percentage of women who earn bachelor's degrees and the median age at which women first get married over time, pupils conduct a linear regression...
Ms. Amber Nakamura's Mathematics Website
Algebra Project
What would your dream house look like? A cottage? A medieval castle? High schoolers enrolled in Algebra design the perfect house while using slopes to write equations for various aspects of the project.
Curated OER
Water Down the Drain
Did you know that leaky faucets waste $10 million worth of water? Conservationists perform an experiment and draw best-fit lines to explore how the US Geological Society determined this value.
Illustrative Mathematics
Distance across the channel
Here you will find a model of a linear relationship between two quantities, the water depth of a channel and the distance across the channel at water level. The cross section of the channel is the shape of an isosceles trapezoid. The...
National Council of Teachers of Mathematics
Bank Shot
Bank on geometry to line up the shot. The resource asks the class to determine the location to bank a cue ball in a game of billiards. Using their knowledge, class members determine where to hit the bumper to make a shot and discuss...
Mathematics Common Core Toolbox
Golf Balls in Water
Here's a resource that models rising water levels with a linear function. The task contains three parts about the level of water in a cylinder in relationship to the number of golf balls placed in it. Class members analyze the data and...
Illustrative Mathematics
Slopes and Circles
An upper-level treatment of what is often presented as a basic concept (the right angle of an inscribed circle on the diameter), this activity really elevates the mathematical thought of the learner! Expected to develop formulas...
PBL Pathways
College Costs 2
What is the financial benefit for attending a community college for the first two years before transferring to a four-year college? The second part of the educational lesson asks young scholars to explore this question through data...
Curated OER
Taxi!
Your young taxi drivers evaluate and articulate the reasoning behind statements in a conceptual task involving linear data. The given data table of distances traveled and the resulting fare in dollars is used by learners to explore...
Curated OER
Triangles Inscribed in a Circle
Are you tired of answers without understanding? Learners can give a correct response, but do they really understand the concept? Have young mathematicians think deeper about linear functions, angles, and formulas in algebra....
Texas Instruments
Texas Instruments: Investigating Properties of Lines in the Plane
In this activity, students draw a line and determine its slope. They understand that the slope of a line is actually the ratio of rise over run.
University of Georgia
University of Georgia: Slope of Lines
This site provides a detailed unit on finding the slope of lines that investigates methods for solving systems of equations. Good lesson plan for class.
Texas Instruments
Texas Instruments: Parallel and Perpendicular Lines on Ti Smartview
This is an introductory lesson on graphing parallel and perpendicular lines. The students will have a good visual on how these lines relate to each other. This also illustrates how to determine equations in slope-intercept form of a line...
Wyzant
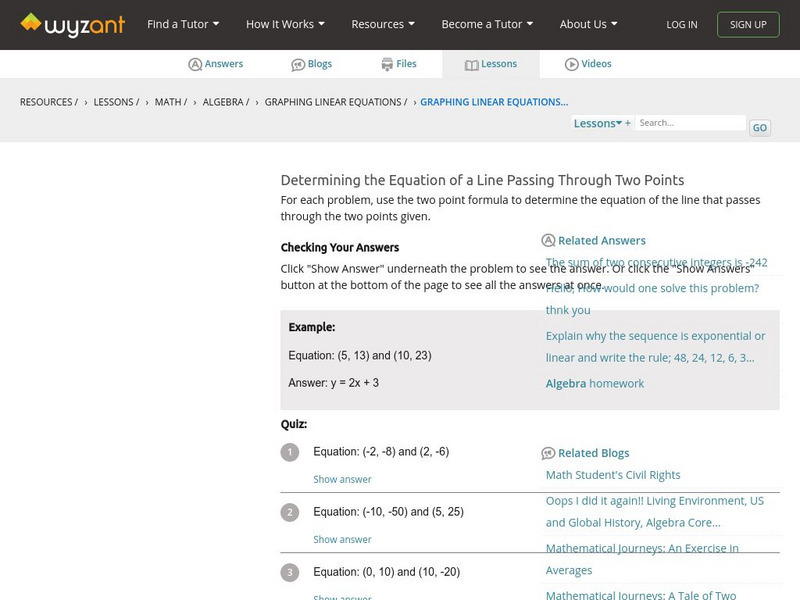
Wyzant: Determining the Equation of a Line Passing Through Two Points
The resource consists of practice problems that examine how to determine the equation of a line passing through two points. Worksheet and answer sheets are included.
Wyzant
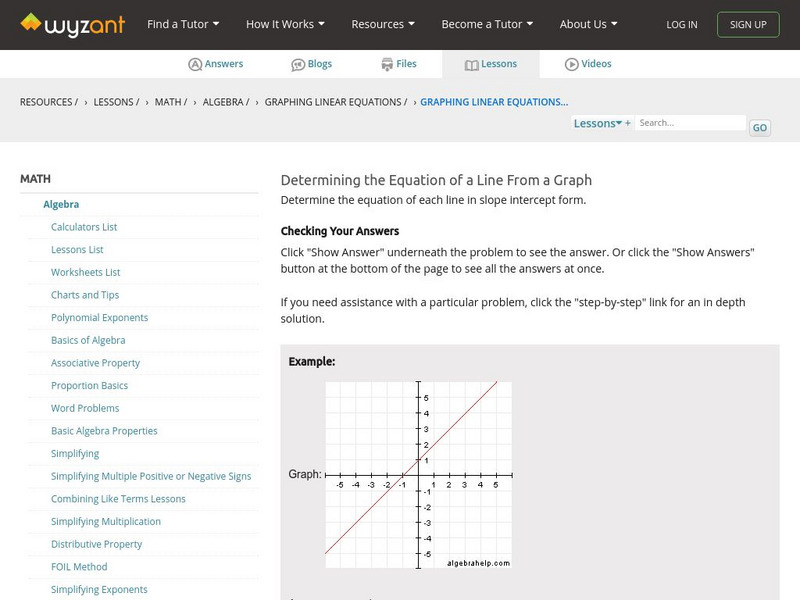
Wyzant: Determining the Equation of a Line From a Graph
The resource consists of practice problems that examine how to determine the equation of a line from a graph. Worksheet and answer sheets are included.
Texas Instruments
Texas Instruments: Getting Started With the Ti Navigator: Equations of My Road
This lesson introduces students to the use of a map of an area, a neighborhood, a favorite city, or an amusement park, to determine the slope of a specific road. Students will find the slope of a line using a coordinate plane.
Texas Instruments
Texas Instruments: A Sweet Drink Adventure 7
Students determine how the temperature of water affects the dissolving time of a sugar cube. They create, interpret and analyze graphs of data, find an equation of the line of best fit, and relate slope to rate of change.
Texas Instruments
Texas Instruments: Math Today for Ti Navigator System: More Students Apply Early
Using the USA TODAY Infograph, "More students apply early," students will explore scatter plots and independent and dependent variables. Students will determine a best-fit regression model for the real-life data set and then use the...


