Curated OER
A Different Point of View
Elementary schoolers utilize a pattern worksheet embedded in this plan to work on a deeper understanding of geometric concepts like symmetry and congruency. Since geometry is such a visual form of mathematics, this lesson should fit...
Curated OER
Views of Shapes
In this math worksheet, students examine the two and three dimensional shapes. They use the observations in order to define the different points of view.
Mathed Up!
Nets, Plans, and Elevations
A dimensional resource teaches viewers to recognize 2-D views of 3-D objects and how to match nets with their 3-D figures. Individuals draw different views of three-dimensional objects including views from the front, side...
Curated OER
Zoom Out
Students explore visual perception and how objects change as distance changes. In this distance and vision instructional activity, students practice their scientific inquiry skills. Students practice drawing objects from different points...
EngageNY
A Synthesis of Representations of Equivalent Ratio Collections
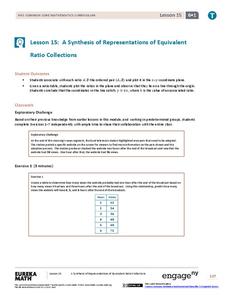
Make all the ratio representations fit together. The 15th segment in a series of 29 presents ratio problems to solve. Scholars use a variety of representations to respond to the questions. The problem set has pupils show how the...
CK-12 Foundation
Continuity at a Point, Continuity Test, Types of Discontinuity: Properties of Continuous Functions
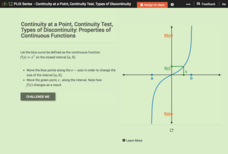
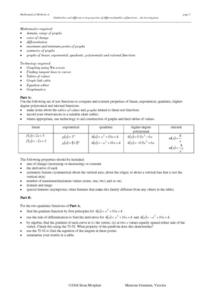
Take a closer look at continuous functions within given intervals. Using the parent cubic function, learners explore properties of continuous functions on intervals. Pupils interpret the Intermediate Value Theorem and the Extreme Value...
Curated OER
Do Two Points Always Determine a Linear Function II?
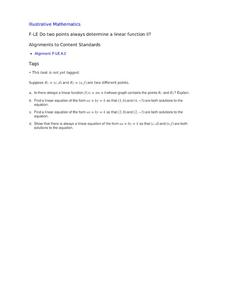
Learners analyze the difference between the slope intercept and standard forms of a line in this task. Given two general points using letters they explore linear functions and linear equations.
Curated OER
Symmetries of a Quadrilateral I
Learners examine the properties of quadrilaterals from the point of view of rigid motion. Different types of quadrilaterals are characterized by their symmetries, so learners explore the symmetries of a described quadrilateral to...
CK-12 Foundation
Circles Centered at the Origin: Dog
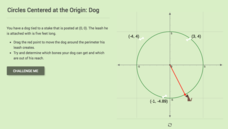
How many bones can a dog on a leash reach? Class members move a dog on the end of its leash and determine whether it can reach bones located at specific points. The learners see whether the bone lies on the circle or outside of the...
Curated OER
Similarities and Differences in Properties of Different Families of Functions - An Investigation
Exploring families of functions allows students compare and contrast properties of functions. Students discuss properties that include symmetry, max and min points, asymptotes, derivatives, etc.
Teach Engineering
Forms of Linear Equations
Linear equations are all about form. The fifth part in a unit of nine works with the different equivalent forms of linear equations. Class members become familiar with each form by identifying key aspects, graphing, and converting...
Illustrative Mathematics
Cari's Aquarium
The volume of a fish tank is a rather important measure when it comes to building an aquarium for different species of fish. In this problem, your kids look at how many different ways they can make a fish tank of a specific volume,...
Curated OER
Density - An Intrinsic Property
Learners discover the property of density while participating in a lab exercise. In this scientific measuring lesson, pupils utilize a scale to measure the density of different metal materials. They document their work and present their...
Illustrative Mathematics
Money in the Piggy Bank
It's time to crack open that piggy bank and see what's inside. First, count up the pennies, nickels, dimes, and quarters, identifying what fraction of them are dimes. Then calculate the total value of the coins, writing another fraction...
Illustrative Mathematics
Lines of Symmetry for Quadrilaterals
Explore how lines of symmetry help define different categories of quadrilaterals. Looking at a square, rectangle, trapezoid, and parallelogram, young mathematicians discover that each shape has its own, unique symmetry. Encourage your...
Shodor Education Foundation
Cross Section Flyer
Scholars see cross sections come to life using an app to investigate cross sections of three-dimensional solids. They look at prisms, pyramids, cylinders, cones, and double cones.
Inside Mathematics
Snakes
Get a line on the snakes. The assessment task requires the class to determine the species of unknown snakes based upon collected data. Individuals analyze two scatter plots and determine the most likely species for five...
Education Development Center
Finding Triangle Vertices
Where in the world (or at least in the coordinate plane) is the third vertex? Given two coordinate points for the vertices of a triangle, individuals find the location of the third vertex. They read an account of fictional...
CK-12 Foundation
Parametric Equations: Protecting the Village
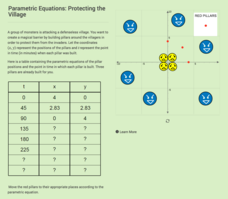
Determine the location of the pillars in time. Given a table of values for two parametric equations, pupils complete the table to determine the location and time it takes to build the pillars. Learners plot the points representing...
EngageNY
Properties of Similarity Transformations
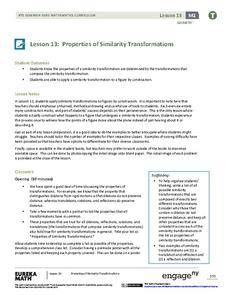
You can explain it, but can you do it? After learners view a sequence of transformations, the next logical step is creating the transformation. Challenge your classes to construct a composition of transformations and verify the...
Annenberg Foundation
Geometry 3D Shapes: 3D Shapes
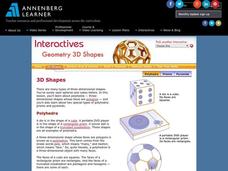
Explore vocabulary related to three-dimensional shapes. An instructional website describes the characteristics of different geometric solids. Learners can use an interactive component to view nets, faces, vertices, and edges of common...
CK-12 Foundation
Vector Subtraction
Move vectors to determine their difference. Pupils use an interactive to visualize the opposite of a vector. They use the concept of adding vectors to subtract vectors by adding the opposite and, finally, view the differences of the...
Shodor Education Foundation
Plop It!
Build upon and stack up data to get the complete picture. Using the applet, pupils build bar graphs. As the bar graph builds, the interactive graphically displays the mean, median, and mode. Learners finish by exploring the changes in...
Kentucky Adult Education
Probability Lesson Plan
Roll the dice with this multimedia math instructional activity on probability. After first viewing a series of three short videos explaining probability, independent events, and dependent events, young mathematicians...


