K-5 Math Teaching Resources
Polygon Sort Sheet
What makes a polygon a polygon and how many different types are there? Invite your scholars to learn and discuss that question with this polygon sort sheet. Learners cut out each polygon and sort them by their different attributes.
K5 Learning
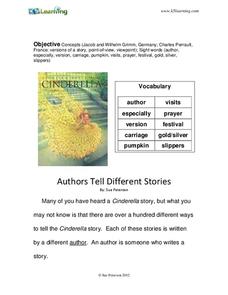
Authors Tell Different Stories
The story of Cinderella is a popular one! So much so, there are multiple versions of the story being told around the world. With this collection of activities your young readers receive background information about two versions...
Virginia Department of Education
Graphs
Examine different types of graphs as a means for analyzing data. Math scholars identify the type of graph from a series of data displays and then develop questions to match each one. Then, given a scatter plot of height versus age data,...
Poetry4kids
How to Write a Clerihew
Writing funny poems is the best part about learning poetic forms! Young poets learn all about clerihews—humorous four-line poems about people—with an explanatory lesson.
CK-12 Foundation
Understand and Create Line Graphs: Line Graphs
Explore line graphs and their characteristics through an interactive lesson. Scholars follow a set of directions to plot data on a line graph. They then answer questions about the type of variables, minimum and maximum values, and...
Curated OER
Parts of a Line
In this parts of line worksheet, students solve and complete 12 various types of problems. First, they find the length of the indicated line segments. Then, students determine the lengths of the line segments listed.
Curated OER
Interactivate - Lines, Rays, Line Segments, and Planes
Young scholars explore lines, rays, line segments, and planes. For this math lesson, students discuss the math concepts and direct their instructor in graphing functions. Young scholars collaborate in graphing additional functions.
Curated OER
Orienteering - Lesson 3 - Topographical Maps and Contour Lines
Learn how to read a topographical map and understand what the contour lines mean. Explore longitude and latitude. Find a cliff, a valley, a mountain peak, and more. This is just one of the ten lessons in this unit on oreinteering....
Mathematics Vision Project
Modeling Data
Is there a better way to display data to analyze it? Pupils represent data in a variety of ways using number lines, coordinate graphs, and tables. They determine that certain displays work with different types of data and use two-way...
CK-12 Foundation
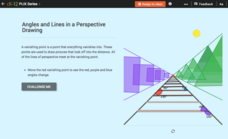
Linear Pairs: Angles and Lines in a Perspective Drawing
Gain some perspective on linear pairs. Aspiring mathematicians adjust the vanishing point on a perspective drawing. They see the effect on linear pairs of angles and answer five challenge questions based on their observations.
Radford University
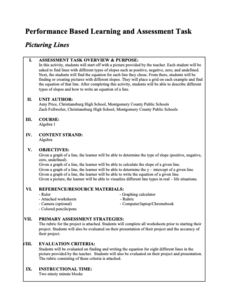
Picturing Lines
Slopes are everywhere—even in houses! Given a picture of a house, learners find lines with positive, negative, zero, and no slopes. Scholars determine the equation of the lines by calculating the slopes and y-intercepts. Class members...
Curated OER
Favorite Food
Students are given three choices of food. They then decide on their favorite and predict what the class's favorite food will be. After the teacher enters the data into the computer, students gather around the computer to view the...
American Museum of Natural History
Earthquakes Tremors From Below
Earthquakes are really no one's fault. A thorough lesson explains the different types of earthquakes how they happen. Learners interact with the online lesson to simulate earthquakes and examine their results. The lesson is appropriate...
Curated OER
Types of Furniture
Students identify illustrations of furniture types. They discuss the different types such as sofas, chairs, beds, etc. and styles of furniture and complete a furniture project. They create their own line of furniture with details to...
Curated OER
Polynominoes
In this polynominoes worksheet, students solve 9 different types of polynominoes problems. First, they identify that a polynominoe is a polygon made from squares of the same size and connected to each square. Then, students determine how...
Illustrative Mathematics
Puppy Weights
Nobody can say no to puppies, so lets use them in math! Your learners will take puppy birth weights and organize them into different graphs. They can do a variety of different graphs and detail into the problem based on your classroom...
EngageNY
How Do Dilations Map Lines, Rays, and Circles?
Applying a learned technique to a new type of problem is an important skill in mathematics. The lesson asks scholars to apply their understanding to analyze dilations of different figures. They make conjectures and conclusions to...
Curated OER
Introduction to Representing and Analyzing Data
Represent data graphically. Allow your class to explore different methods of representing data. They create foldables, sing songs, and play a dice game to reinforce the measures of central tendency.
Curated OER
Line Graphs and Commercial Costs
Learners investigate line graphs. In this middle school mathematics instructional activity, students compare and contrast different types of graphs and create line graphs based on the data provided.
Mathed Up!
Scatter Graphs
Make an estimate by getting in line. The class works with scatter plots and lines of best fit to make an estimate for given values. Pupils determine whether there is a positive or negative correlation and draw a best-fit line. Using the...
Curated OER
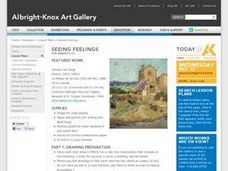
Seeing Feelings
Young scholars create pencil drawings of assigned items and then, study painting by Vincent Van Gogh. They discuss how different colors make them feel and are then assigned a mood to express by adding color to their line drawing.
Science Matters
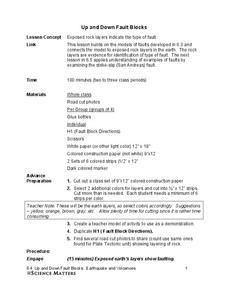
Up and Down Fault Blocks
The Sierra Mountains in Nevada and the Tetons in Wyoming originally formed as fault block mountains. In order to visualize these fault blocks, pupils use construction paper to create layers of earth. They cut the paper models and form...
CK-12 Foundation
Graphs for Discrete and for Continuous Data: Discrete vs. Continuous Data
Not all data is the same. Using the interactive, pupils compare data represented in two different ways. The learners develop an understanding of the difference between discrete and continuous data and the different ways to represent each...
Shodor Education Foundation
Data Flyer
Fit functions to data by using an interactive app. Individuals plot a scatter plot and then fit lines of best fit and regression curves to the data. The use of an app gives learners the opportunity to try out different functions to see...


