Balanced Assessment
A Run for Two
Develop a graph to represent the distance between two cars. The assessment task presents a scenario in which two cars are traveling at constant speeds with one faster than the other. Pupils develop graphical representations to show the...
101 Questions
Stopping Distances
In 2016, one in every four fatal car crashes listed speeding as a contributing factor. Pupils view videos of a car trying to come to a quick stop from four different rates of speed. They use context clues to measure and determine the...
InqueryPhysics
Interpreting Motion Graphs
Every movement in the world can be measured and even motionless objects can be significant indicators of movement. Focus on motion graphs that feature distance vs. time, speed vs. time, and positive and negative acceleration.
Curated OER
Acceleration Lab
Young Einsteins experiment with the acceleration of Hot Wheels™ toy cars down inclined planes at various angles. This classic physics lab activity is thoroughly explained in both a teacher’s guide and a student lab sheet. Science...
NASA
Lunar Rover
What is the shortest distance/time needed to complete a mission? Groups devise a strategy in order to determine the shortest distance and time connecting two points and a segment. They then use graphing, the distance formula, and a...
Columbus City Schools
Speed Racers
Who wants to go fast? The answer? Your sixth-grade science superstars! The complete resource offers the ultimate, all-inclusive playbook for mastering the important concepts of speed versus time; distance versus time; and how to graph...
Curated OER
Use Google Maps to Teach Math
Capture the engagement of young mathematicians with this upper-elementary math lesson on measuring time and distance. Using Google Maps, students first measure and compare the distance and time it takes to travel between different...
EngageNY
Graphs of Functions and Equations
Explore the graphs of functions and equations with a resource that teaches scholars how to graph functions as a set of input-output points. They learn how the graph of a function is the graph of its associated equation.
Education Development Center
Distance, Rate, and Time—Walking Home
Dig into a classic math problem with your classes. Through an engaging task, learners work with rate and distance information to make conclusions. In the task, two people walk at different rates; one leaves first, and scholars calculate...
Curated OER
Drive the Data Derby
Three days of race car design and driving through the classroom while guessing probability could be a third graders dream. Learn to record car speed, distances traveled, and statistics by using calculation ranges using the mean, median,...
Curated OER
Math: Real Time and Live
Get an interdisciplinary edge. Scholars study air contamination and slope. They record the time it takes for air fresheners to reach them at variable distances. They document their times, classify them by distance, and draw a scatter...
Curated OER
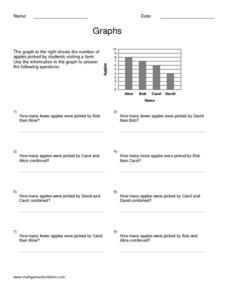
Graphs
In this graphing worksheet, students read information and study diagrams about graphing. Students complete 3 graphing activities.
Curated OER
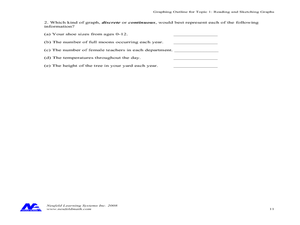
Reading and Sketching Graphs
In this graphs worksheet, students answer 15 multistep questions about graphs. Students determine distance traveled, time, velocity, and create scenarios to fit the graph.
Curated OER
Regents Exam Questions: Distance
In this distance worksheet, high schoolers solve 12 multiple choice, short answer, and graphing problems. Students use the distance formula to find the distance between two points.
Illustrative Mathematics
Velocity vs. Distance
At the end of this activity, your number crunchers will have a better understanding as to how to describe graphs of velocity versus time and distance versus time. It is easy for learners to misinterpret graphs of velocity, so have them...
Teach Engineering
Matching the Motion
It is not always easy to walk the straight and narrow. In the sixth portion of a nine-part unit, groups actively recreate a graph depicting motion. Individuals walk toward or away from a motion detector while trying to match a given...
Curated OER
Exploring Quadratic Data : Transformation Graphing
High schoolers analyze the vertex form of a parabola and find an approximate fit of a model. They explain the quadratic parabola function and its properties by developing quadratic models. They use translation and dilation to change the...
Curated OER
Walking the Plank
This is a cool math activity. Kids collect and interpret data based on a physical act. A board is balanced between a scale and a step, learners record a peer's weight as it decreases while s/he walks further away from the scale. They...
Curated OER
Regents High School Examination - Physics 2010
Give every type of learner in your physics class an opportunity to demonstrate what they have learned throughout the year. From analyzing tables and graphs, to evaluating diagrams and solving problems, there is an outstanding variety of...
Curated OER
Data Collection
Students write a journal exercise that relates to pets. They collect information from each other in order to practice making and interpreting bar graphs. They Continue building different kinds of graphs with the group.
Curated OER
Real Life Graphs
In this real life graphs learning exercise, students examine graphs and determine the equation of a line. They interpret distance time graphs and draw graphs to match a real life situations. This three-page learning exercise contains 3...
Illustrative Mathematics
Bike Race
A graph not only tells us who won the bike race, but also what happened during the race. Use this resource to help learners understand graphs. The commentary suggests waiting until the end of the year to introduce this topic, but why...
Curated OER
X vs. T graphs
In this X vs. T graph, students sketch velocity vs. time graphs corresponding to the following descriptions of the motion of an object. Students also draw the velocity vs. time graphs for an object whose motion produced the distance vs....
Balanced Assessment
All Aboard
Pupils must graph the location of a train using the time given a timetable. They analyze the different legs of the trip, graph the return trip, and compare the two graphs. The lesson ends with a discussion of similarities and differences...
Other popular searches
- Distance Time Graph Story
- Physics Distance Time Graph
- Distance Time Graphs Physics
- Graphing Distance and Time
- Time Distance Graphs
- Graphing Speed Distance Time
- Graphing Distance Time
- Time and Distance Graphs
- Time Distance Graph
- Time vs Distance Graphing


