Curated OER
Buses
Busy buses bustling back and forth. For this middle school assessment task, learners use information given in a graph to answer questions about bus schedules. They then determine how many times a bus passes by other buses going in the...
Curated OER
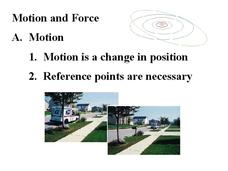
Motion and Force
All the main concepts in motion and force are covered in this presentation. Each slide is a great summary and will appeal to your students with a clean design and images that should seem relevant. Definitions of speed, displacement,...
Mathalicious
The Fall of Javert
Falling off a bridge might not sound like your idea of a good math problem, but incorporating the final scene of Les Misérables is sure to spark interest. The goal is to use the time Javert fell off the bridge to determine how high he...
Curated OER
Using Graphs
In this using graphs worksheet, 9th graders solve and complete 6 different types of problems. First, they determine how the transformation shown moves the graph. Then, students find the interval that is defined given the coordinates....
Curated OER
What's Your Speed?
Learners explore the concept of distance v. time. They use a CBR to collect data on their distance over time, then plot their data using a scatter plot and find an equation to model their data. Pupils discuss what if scenarios which...
Curated OER
Graphs of Direct Variation
Young scholars identify graphs for direct variation. For this algebra worksheet, students analyze graphs to determine their direct variation. They also determine whether the graphs are functions or not.
Curated OER
Graphs and Direct Variation
Students solve problems with direct variation. In this algebra instructional activity, students analyze graphs to figure out the direct variation of a line. They observe the slopes based the steepness of the lines.
Curated OER
Speed II Problems
In this higher-level math worksheet, students complete 10 problems involving speed, distance, time, and length using graphs and pictures. An excellent worksheet with easy-to-understand graphics and problems.
Curated OER
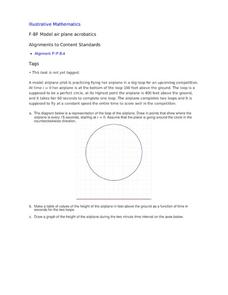
Model Air Plane Acrobatics
Your young airplane enthusiasts will enjoy this collaborative task of graphing an airplane's distance from the ground as it flies in a perfect circle. They will discover that they have graphed a sinusoidal function that comes from the...
Edmond Public Schools
8th Grade Science Resource Book: Unit 2 - Physics
Get things moving with this extensive collection of physical science resources. Covering the fundamentals of measurement, graphing, lab safety, and experimental design as well as the specific scientific concepts of velocity,...
Curated OER
Let's Plot Points
Use coordinate grid paper to plot points and identify shapes that are already plotted on the paper by saying their coordinates. Pupils also measure the distance between points and play the game Battleship. There are several web links and...
Curated OER
Curve Ball
Create a Height-Time plot of a bouncing ball using a graphing calculator. Graph height as a function of time and identify the vertex form of a quadratic equation that is generated to describe the ball's motion. Finally, answer questions...
Curated OER
Distance Calculations
Students calculate the distance between two points. In this geometry lesson, students use coordinates and the distance formula to find the distance. They perform an interactive lesson to solve the missing length.
Curated OER
Average and Instantaneous Velocity
In this velocity worksheet, students determine the average velocity for a trip, graph the distance traveled as a function of time, estimate the slope and identify the instantaneous rate of change of the function. This two-page worksheet...
Curated OER
Chart Your Course
Middle schoolers explore change represented in graphs comparing distance and time. They exchange and share their graphs. Students interpret and create distance versus time line-graphs, and write stories based on these graphs. They...
Curated OER
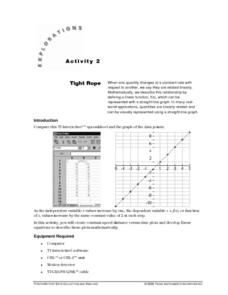
Tight Rope
Learn how to explore the concept of linear functions. In this linear functions lesson, high schoolers collect linear data from a motion detector. Students walk to create a linear function. High schoolers plot the points on a graph and...
Curated OER
The 100 Meter Race Problem
In this meter worksheet problem, students read a word problem and interpret a graph. They use the derived information to determine time and distance. This one-page worksheet contains 1 multi-step problem. Answers are provided at the...
Curated OER
Lego Robotics: Measuring Speed
Students build and program a LEGO robotic car as well as measure and graph its speed. They acquire familiarity with principles of construction, motion, design and problem solving. They compare a robot's speed over two different surfaces...
Curated OER
Then and Now
Students conduct research and use census data to compare different times and places. In this census lesson, students interpret data from charts and graphs, comparing census information from two time periods as well as from two different...
Curated OER
How Far Did They Go?
Students create a map. In this direction and distance lesson, students come up with familiar places in the community and calculate the distances from these places to the school. Students create a map that displays these places and their...
Curated OER
The Hudson's Ups and Downs
Fifth graders practice interpreting line graphs of the Hudson River water levels to assess the tides and tidal cycles in the estuary. They explore how weather can affect water levels and tides and observe that high tides and low tides...
PBS
Working with Coordinate Planes: Assessments
It's time for scholars to show what they know about coordinate planes with a collection of three assessments. The exams' objectives include plotting points on a single grid, measuring using the distance formula, and identifying points on...
Mathematics Vision Project
Module 6: Trigonometric Functions
Create trigonometric functions from circles. The first lesson of the module begins by finding coordinates along a circular path created by a Ferris Wheel. As the lessons progress, pupils graph trigonometric functions and relate them to...
Kenan Fellows
Introduction to a Flight Computer
Keep your hands on the wheel—at all times! Scholars learn why pilots use a flight computer through a high-flying demonstration. Making calculations for speed, distance, or time is automatic if you know how to use a flight computer.


