Curated OER
What's Your Speed?
Learners explore the concept of distance v. time. They use a CBR to collect data on their distance over time, then plot their data using a scatter plot and find an equation to model their data. Pupils discuss what if scenarios which...
Curated OER
Regents High School Examination - Physics 2010
Give every type of learner in your physics class an opportunity to demonstrate what they have learned throughout the year. From analyzing tables and graphs, to evaluating diagrams and solving problems, there is an outstanding variety of...
Curated OER
Graphs
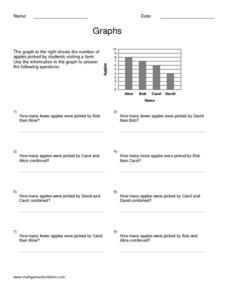
In this graphing worksheet, students read information and study diagrams about graphing. Students complete 3 graphing activities.
Curated OER
Motion: Speed, Velocity, Acceleration and Networking
Students interpret a variety of motion graphs. In this physics lesson, students calculate the speed and acceleration of objects using numerical data from graphs. They apply what they have learned to solve real world problems.
Curated OER
Speed II Problems
In this higher-level math worksheet, students complete 10 problems involving speed, distance, time, and length using graphs and pictures. An excellent worksheet with easy-to-understand graphics and problems.
Curated OER
Graphing Speed
For this graphing worksheet, students read about independent and dependant variables and learn how to determine speed from the slope of a position vs. time graph. This worksheet has 4 matching, 17 fill in the blank, and 2 problems to solve.
Curated OER
Graphing Speed; Slope
In this graphing speed worksheet, students find the slope in a position vs. time graph to be the speed. They are given example graphs of position vs. time to show the changes in slope reflect the changes in speed. Students match terms...
Curated OER
Lego Robotics: Measuring Speed
Learners build and program a LEGO robotic car as well as measure and graph its speed. They acquire familiarity with principles of construction, motion, design and problem solving. They compare a robot's speed over two different surfaces...
Curated OER
Graphing Linear Motion
In this graphing linear motion worksheet, students answer 20 questions about velocity of objects, the distance they travel and the time. They interpret a graph of position vs. time and identify the velocity at certain point on the graph.
Curated OER
Position and Velocity vs. Time Graphs
In this position and velocity worksheet, students sketch graphs of position vs. velocity and position vs. time for 6 problems given different scenarios. They label their graphs with given positions, velocities and times.
Curated OER
Motion Graphs
In this motion graphs worksheet, students learn about how motion of objects can be described using a graph. Students then answer 10 fill in the blank, 10 short answer, and 5 problems to solve.
Curated OER
Solar Speed
Students perform unit conversion. In this algebra lesson plan, students calculate the distance and speed of a solar car. They graph their result as speed versus distance and analyze it.
Illustrative Mathematics
Bike Race
A graph not only tells us who won the bike race, but also what happened during the race. Use this resource to help learners understand graphs. The commentary suggests waiting until the end of the year to introduce this topic, but why...
Curated OER
How Fast is it Traveling?
Middle schoolers calculate the rate of speed of various moving objects within the classroom setting, or outside under a controlled environment.
Curated OER
Motion and Force
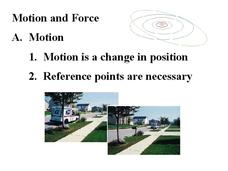
All the main concepts in motion and force are covered in this presentation. Each slide is a great summary and will appeal to your students with a clean design and images that should seem relevant. Definitions of speed,...
EngageNY
Comparing Linear Functions and Graphs
How can you compare linear functions? The seventh installment of a 12-part module teaches learners how to compare linear functions whose representations are given in different ways. They use real-world functions and interpret features in...
Curated OER
Calculating Speed
Fourth graders complete an experiment on calculating speed. In this speed calculation activity students complete an activity in which they have dominoes fall as slow as possible.
Curated OER
Velocity and Acceleration
Compliment your physics lesson with this PowerPoint which demonstrates many important points regarding acceleration and velocity. A starter experiment activity to stimulate student thinking is given, and may prove very interesting to a...
Illustrative Mathematics
Walk-a-thon 1
Your mathematician's job is to explore the relationship between hours and miles walked during a walk-a-thon. The activity compels your learners to experiment with different means in finding out this proportional relationship. The answer...
Curated OER
Finding Ocean Depth
How to oceanographers measure the sea's depth? Your scientists will step into their shoes in this application worksheet, first reading about how the speed of sound and a simple formula give scientists a depth estimation. Students...
Curated OER
Hot Wheelin' Physics
For this physics worksheet, students complete a lab activity and record their results in the charts shown. They calculate the speed for each trial using the total time and total distance. Students also graph their results.
Inside Mathematics
Squares and Circles
It's all about lines when going around. Pupils graph the relationship between the length of a side of a square and its perimeter. Class members explain the origin in context of the side length and perimeter. They compare the graph to the...
EngageNY
Graphs of Piecewise Linear Functions
Everybody loves video day! Grab your class's attention with this well-designed and engaging resource about graphing. The video introduces a scenario that will be graphed with a piecewise function, then makes a connection to domain...
Curated OER
Acceleration and Average Speed
In this acceleration and average speed worksheet, students learn the equations for acceleration and average speed. They match 6 variables with their quantities, they identify speed vs. velocity and scalar vs. vector and they solve 4...


