Mathematics Assessment Project
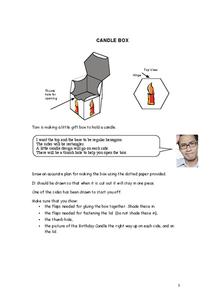
Candle Box
Individuals draw a net for a hexagonal pyramid — with some stipulations. The net must contain the printed images so they appear correctly on the box, along with tabs to glue the box together.
West Contra Costa Unified School District
Solving Inequalities
What does translating points on a number line have to do with solving inequalities? Young mathematicians first learn about translations of points on a number line, and then use this information to solve linear inequalities in one variable.
Statistics Education Web
Are Female Hurricanes Deadlier than Male Hurricanes?
The battle of the sexes? Scholars first examine data on hurricane-related deaths and create graphical displays. They then use the data and displays to consider whether hurricanes with female names result in more deaths than hurricanes...
Curriculum Corner
Ice Cream Booklet
On the days leading up to summer, use a booklet of practice skill sheets in the classroom. Beginner pupils should be able to master the skills they've learned in math and reading before they head home for the summer, like counting to 30,...
Georgia Department of Education
Math Class
Young analysts use real (provided) data from a class's test scores to practice using statistical tools. Not only do learners calculate measures of center and spread (including mean, median, deviation, and IQ range), but...
Willow Tree
Bar Graphs
Circles, lines, dots, boxes: graphs come in all shapes in sizes. Scholars learn how to make a bar graph using univariate data. They also analyze data using those bar graphs.
EduGAINs
Data Management
Using a carousel activity, class members gain an understanding of the idea of inferences by using pictures then connecting them to mathematics. Groups discuss their individual problems prior to sharing them with the entire class....
Virginia Department of Education
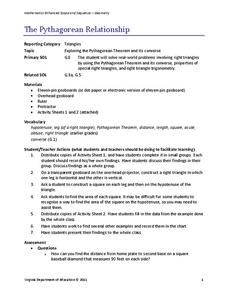
The Pythagorean Relationship
Add up areas of squares to discover the pythagorean relationship. Small groups create right triangles with squares along each side. They calculate the areas of each square and notice the relationship. Groups construct other types of...
EngageNY
Sampling Variability
Work it out — find the average time clients spend at a gym. Pupils use a table of random digits to collect a sample of times fitness buffs are working out. The scholars use their random sample to calculate an estimate of the mean of the...
EngageNY
Variability in a Data Distribution
Scholars investigate the spread of associated data sets by comparing the data sets to determine which has a greater variability. Individuals then interpret the mean as the typical value based upon the variability.
EngageNY
The Mean Absolute Deviation (MAD)
Is there a way to measure variability? The ninth resource in a series of 22 introduces mean absolute deviation, a measure of variability. Pupils learn how to determine the measure based upon its name, then they use the mean...
EngageNY
Comparing Data Distributions
Box in the similarities and differences. The 19th lesson in a unit of 22 presents class members with multiple box plots to compare. Learners use their understanding of five-number summaries and box plots to find similarities and...
Poston Butte High School
Literacy Language Kit for the Book Hi! Fly Guy
Create a buzz in your class with this collection of learning activities for the book Hi! Fly Guy. Including a list of comprehension questions, a sequence of events activity, a summary writing assignment, and a vocabulary list, this...
Statistics Education Web
The United States of Obesity
Mississippi has both the highest obesity and poverty rate in the US. Does the rest of the data show a correlation between the poverty and obesity rate in a state? Learners tackle this question as they practice their skills of regression....
Statistics Education Web
Text Messaging is Time Consuming! What Gives?
The more you text, the less you study. Have classes test this hypothesis or another question related to text messages. Using real data, learners use technology to create a scatter plot and calculate a regression line. They create a dot...
Curated OER
Connect the Dots: The Letter Pp
In this dot to dot learning exercise, students connect the numbered dots that trace the capital letter P and the lower case p. The objective is to advance students' letter recognition and printing skills.
Curated OER
Count the Dots
In this counting to 5 activity, students cut out and color 2 sets of dots numbered from 1 to 5. Students then glue the dots onto a butterfly and a ladybug.
Curated OER
ESL Vocabulary Connect the Dots: Feeling
In these English Language vocabulary worksheets, students use the pictures to help them identify the feeling words. Students connect the dots from the pictures to their matching words. Students then trace the words and find the missing...
Curated OER
Counting to Eight- Printing Practice
In this math and number printing page, students count eight black line pictures of beans. They trace the number 8 on a line below the pictures by printing 8's on dotted lines that fade out with each number that is practiced.
Curated OER
Colt Dot to Dot - Numbers 1-52
In this dot to dot learning exercise, students start at the number 1 and follow through to the number 52 to form a picture of a colt. There are no directions with the page but the students could color the pictures after completing the...
Curated OER
Rockfish Dot To Dot
In this science worksheet, 2nd graders will complete a dot to dot. Students will connect the dots from one to forty-three to create the prey of a rockfish.
Curated OER
Dot to Dot by Fives
In this counting by 5's dot to dot instructional activity, learners connect the dots as they count from 5 to 150. Students color the picture of the pig.
Curated OER
Miss Muffett Dot to Dot - Numbers 1-18
In this nursery rhyme instructional activity, students read "Little Miss Muffet." They complete a dot to dot puzzle of a spider's web by following the number one through eighteen.
Curated OER
Alphabet Flower Dot to Dot
In this language arts worksheet, students follow the alphabet letters to complete a dot to dot picture. Students will discover a garden flower which they can color.
Other popular searches
- Dot to Dot Worksheets
- Dot to Dot Puzzle
- Alphabet Dot to Dot
- Dot to Dot Picture
- Halloween Dot to Dot Picture
- Dinosaur Dot to Dot
- Duck Dot to Dot
- Dot to Dot 1 30
- Cat Dot to Dot
- Number Dot to Dot
- Dot to Dot Fish
- Dot to Dot Heroes


