Concord Consortium
King for a Day
Rumor has it exponential functions help solve problems! In a kingdom filled with rumors, young scholars must determine the speed a rumor spreads. The ultimate goal is to decide how many people must know the rumor for it to spread to the...
Concord Consortium
Betweenness IV
Challenge your classes to think between the curves. Given two function formed by the combination of two exponential functions, individuals must write three functions in which all values would lie between the given. The question is...
Concord Consortium
Functions by the Slice
Piece by piece ... dismantling a function can highlight interesting patterns. The task asks learners to slice functions in sections with the same vertical change. They then recreate the graph with these slices positioned horizontally....
Balanced Assessment
A Loud Noise
In a scale measuring noise, an increase in 10 dB is a 10 time increase in power. Mathematicians examine the data graph of a real world exponential growth, with no logarithmic scale, and then create two equations relating the...
Curated OER
Integrated Algebra Practice: Exponential Growth
In this exponential growth worksheet, students solve 10 multiple choice and short answer problems. Students find the interest of an amount of money given the rate, time, and times compounded.
Curated OER
Continuous Probability Distributions
In this continuous probability distribution worksheet, learners identify discrete and continuous distributions. They calculate the linear combination of the independent normal random variable and determine probabilities using exponential...
Concord Consortium
Losing Track
Don't lose the chance to use the task. Given three diagrams of curved pieces of wires, young mathematicians must explain whether it's possible to conclusively match the wires as representing cubic, exponential, or quadratic functions....
Balanced Assessment
Catenary
Develop a model for a hanging chain. Pupils find a mathematical model for a hanging chain and then they compare their models to the precise function that models the curve. Scholars come up with a strategy to determine how close...
Illustrative Mathematics
The Djinni’s Offer
The djinni in this resource offers gold coins. Learners use the properties of exponents to make their decision as one offer increases exponentially. This makes a great group project. As the commentary suggests, start by having groups...
Concord Consortium
Writing and Sketching I
Writing and sketching functions—what more could you want to do? Learners write and sketch functions that meet certain conditions as they complete a short task. They find a parabola that encompasses three quadrants of the coordinate plane...
Curated OER
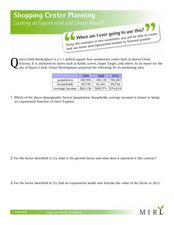
Looking at Exponential and Linear Models
In this shopping center worksheet, students use exponential and linear models to complete word problems about a shopping center. Students complete 6 problems.
Concord Consortium
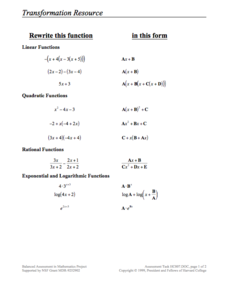
Transformations Resource
Transform your lesson for transforming functions. Scholars transform linear, quadratic, exponential, rational, and trigonometric expressions. They write their expressions to fit specific forms and identify the values of the resulting...
Illustrative Mathematics
Modeling London's Population
Looking at London's population from 1801–1961 in 20 year increments, high school mathematicians determine if the data can be modeled by a given logistic growth equation. They explain their thinking and determine the values of each...
Achieve
Stairway
It's the stairway to learning! Scholars research all aspects of building a staircase. Using information from building codes, they write and graph a system of inequalities to analyze the constraints. The completed project is a scale model...
EngageNY
Relationships Between Two Numerical Variables
Working in small groups and in pairs, classmates build an understanding of what types of relationships can be used to model individual scatter plots. The nonlinear scatter plots in this activity on relationships between two numerical...
Concord Consortium
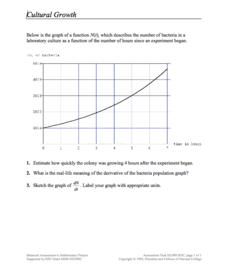
Cultural Growth
Scholars read and interpret a graph relating bacterial growth in a culture over time. They apply knowledge of derivatives, estimation, and graphing to the skill practice questions.
EngageNY
Relationships Between Two Numerical Variables
Is there another way to view whether the data is linear or not? Class members work alone and in pairs to create scatter plots in order to determine whether there is a linear pattern or not. The exit ticket provides a quick way to...


