Charleston School District
Solving Systems Graphically
When guess and check gets old, it's time to start graphing! An instructive lesson explains how to solve a system of linear equations using graphing. Equations are in both slope-intercepts and standard form.
Curated OER
Rates and Slopes: An Astronomical Perspective
In this rates and slopes activity, students solve 2 problems where they find the rate corresponding to the speed of the galaxies in a Hubble diagram for galaxies and they calculate the rate of the sunspot number change between indicated...
Concord Consortium
Function Project
What if a coordinate plane becomes a slope-intercept plane? What does the graph of a linear function look like? Learners explore these questions by graphing the y-intercept of a linear equation as a function of its slope. The result is a...
EngageNY
Lines That Pass Through Regions
Good things happen when algebra and geometry get together! Continue the exploration of coordinate geometry in the third lesson in the series. Pupils explore linear equations and describe the points of intersection with a given polygon as...
Balanced Assessment
On Averages and Curves
Determine the average on a curve. The class finds graphical representations of averages and expresses them both symbolically and on the graph. The assessment requires class members to justify using average to describe graphs.
Curated OER
Find the Intercepts
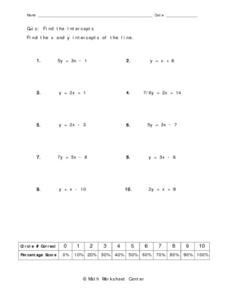
In this intercepts worksheet, 9th graders solve 10 different problems that include determining the intercepts of each equation. First, they set y equal to zero and solve for x. Then, they set x equal to zero and solve for y. They also...
Willow Tree
Graphing
So many methods and so little time! The efficient method of graphing a linear equation depends on what information the problem gives. Pupils learn three different methods of graphing linear equations. They graph equations using...
Flipped Math
Graphs of Functions
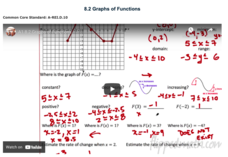
Create a graphical description. Pupils watch a video presentation starting with vocabulary on properties of a graph of a function and then use the vocabulary to find key features of graphs of a function. Scholars use three graphs in the...
West Contra Costa Unified School District
Derivative – Standard Definition
Making a clear connection to algebra concepts helps learners understand the definition of a derivative. The lesson plan begins with looking at limits of simple linear and rational functions, and leads to the definition of...
Curated OER
Quick Graphs of Linear Equations
Graph equations of lines using the slope-intercept method or by plotting both x and y intercepts. Determine if two lines are parallel or perpendicular by comparing their slopes. This handout includes step-by-step directions and four...
West Contra Costa Unified School District
Graphing Systems
Get hands on with solving systems of equations graphically. A solid lesson plan uses guided practice to show how to solve systems of linear equations. It allows time for sharing ideas and provides a printable matching activity...
Inside Mathematics
Swimming Pool
Swimming is more fun with quantities. The short assessment task encompasses finding the volume of a trapezoidal prism using an understanding of quantities. Individuals make a connection to the rate of which the pool is filled with a...
Illustrative Mathematics
Chicken and Steak, Variation 2
Many organizations put on barbecues in order to make money. In a real-world math problem, the money allotted to purchase steak and chicken at this barbecue is only one hundred dollars. It is up to your potential chefs to figure out how...
West Contra Costa Unified School District
Introduction to Inverse Functions
Ready to share the beauty of the inverse function with your classes? This algebra II lesson guides the discovery of an inverse function through a numerical, graphical, and an algebraic approach. Connections are made between the three,...
Curated OER
Derivatives of Inverse Functions
In this derivatives worksheet, students use the chain rule to show equalities between functions. They read a tutorial that guides them through the process of using the chain rule to find derivatives. This worksheet includes five short...
Charleston School District
Solving Systems by Inspection
Can you solve a system by just looking at it? The previous lessons in the series taught three methods of solving systems of equations. Now learners discover they can determine the number of solutions of a system just by looking at it....
Inside Mathematics
Graphs (2007)
Challenge the class to utilize their knowledge of linear and quadratic functions to determine the intersection of the parent quadratic graph and linear proportional graphs. Using the pattern for the solutions, individuals develop a...
Curated OER
Sedimentary Rocks Worksheet
In this geology lab worksheet, students answer 31 short answer questions about sedimentary rocks. Teacher needs to provide text or internet site for students to find answers.
Curated OER
Inverse Variation
In this algebra worksheet, students find the inverse of an equations. They graph their solutions and analyze it. There are 8 questions.
Curated OER
High School Mathematics Problems from Alaska: Reading a Graph: Azimuth Range vs. Day in Barrow, Alaska
Students focus on reading and interpreting information from a graph.
Math Graphs
Houghton Mifflin: Math Graphs: Slope of a Tangent Line 15 [Pdf]
The practice problem compares finding the slope of the tangent line graphically and analytically. The handout is available in PDF format.
Math Graphs
Houghton Mifflin: Math Graphs: Slope of a Tangent Line 16 [Pdf]
The practice problem compares finding the slope of the tangent line graphically and analytically. The handout is available in PDF format.


![Houghton Mifflin: Math Graphs: Slope of a Tangent Line 15 [Pdf] Unknown Type Houghton Mifflin: Math Graphs: Slope of a Tangent Line 15 [Pdf] Unknown Type](https://d15y2dacu3jp90.cloudfront.net/images/attachment_defaults/resource/large/FPO-knovation.png)