University of Saskatchewan
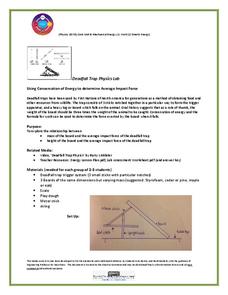
Using Conservation of Energy to Determine Average Impact Force
Explore the center of gravity with your science class as they create a deadfall trap with common materials. They research the concepts of energy conservation and gravitational force before dividing into small groups to create a model of...
Bowland
AstroZoo
Rescue animals in the zoo by applying math concepts. Groups of learners solve three missions involving oxygen, food, and climate control. Each group selects an animal from one of four bio-domes.
Polar Trec
Plankton Parents
Plankton are so abundant in the ocean they outweigh all of the animals in the sea. In this three day activity, groups discuss and become familiar with plankton, capture females, and look for egg production on day three.
Chicago Botanic Garden
Calculating Your Ecological Footprint
You can lower your ecological footprint by recycling! Lesson four in this series of five has individuals, through the use of a computer, calculate their ecological footprints. Through discussions and analysis they determine how many...
Science Matters
Ring of Fire
Over a period of 35 years, earthquakes and volcanoes combined only accounted for 1.5 percent of the deaths from natural disasters in the United States. The 15th lesson in a 20-part series connects the locations of earthquakes and...
Curated OER
What's The Teacher's Choice?
Fifth graders explore how to use data and display it using a chart or graph. They use food choices for categories and then gather the data and use the provided chart for display. In small groups students discuss the data and the results.
Curated OER
Parts Per Million
Students perform serial dilution of food coloring experiment with partner, examine concentration levels, and differentiate parts per million (PPM) and parts per billion (PPB). Students complete pre-lab and post-lab questions and data table.
Curated OER
The Portion is the Poison
Students calculate the amount of everyday food products or liquids that would need to be consumed in order to become toxic. By using unit analysis, they calculate the amount of certain common food items that would need to be consumed in...
Curated OER
Graphs Abound
Students create a survey for their classmates to collect data on their favorite foods, eye color, pets or other categorical data. They compile the data from the survey in a table and then make a bar graph of each category using a web tool.
Curated OER
Life In Extreme Environments
Students work together to design and participate in experiments to determine the rate rotifers eat. After completing their experiments, they record and analyze their data and identify any challenges faced during the procedure. They...
Curated OER
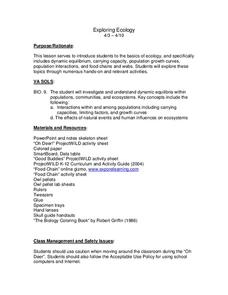
Exploring Ecology
Learners explore the basics of ecology through numerous hands-on and relevant activities. They participate in an online food chain demonstration, which explores food web dynamics. They dissect owl pellets, examine the prey's bones, and...
Curated OER
"Mush Lab"
Students use the information they learned from reading food labels to create mush meals. They blend unlikely meals together to form the mush and then evaluate its nutritional value. They examine their own eating habits after the lab is...
Curated OER
Sustainable Dining
Students identify consumer products and sustainable foods. They calculate the differences in prices and applying those prices to the cost of a meal. They also discuss the costs and benefits of buying sustainable products.
Curated OER
Awesome Animals
Students collect data from classmates about their favorite animal. They use the ClarisWorks graphing program to enter data, graph results, and interpret data.
Curated OER
Chart/Graph
Students create a class survey, place the data in a spreadsheet and graph the information.
Curated OER
Declaration of Independence
Eleventh graders interpret and analyze political cartoons. In this primary source analysis lesson, 11th graders examine the implications of Industrialization as they respond to questions regarding selected political cartoons about the...
Curated OER
Tally Time
Students create a tally chart. In this math and health activity, students discuss healthy foods and create a tally chart showing the number of students who like to eat healthy foods.
Curated OER
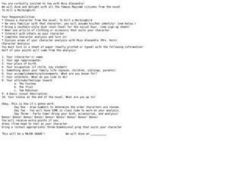
To Kill a Mockingbird Tea
Ninth graders assume the identity of a character from the novel, To Kill A Mockingbird. They bring a southern-style dish (soul food) for social hour and wear an article of clothing that suits the character. They interact with other...
Curated OER
Collecting Compost
Students observe a composting box. For this soil lesson, students create a composting bin by using a bin, newspaper, worms, and food scraps. Students create a composting food web.
Curated OER
Bias Sampling
Students explore statistics by conducting a scientific study. In this data analysis activity, students conduct a class poll about popular foods of their classmates. Students complete a worksheet and discuss how bias opinions affect the...
Curated OER
Counting Calories
Students evaluate the health of breakfast foods. They create and solve word problems using cereal nutrition data. They solve additional problems formulated in class and write short essay on what they learned.
Curated OER
Experiences and Experiments - There is a Difference
Sixth graders plan and conduct an experiment on food spoilage. They design the experiment, create a display, record and analyze data, and make inferences regarding the results of the experiment.
Curated OER
Hey, Mom! What's for Breakfast?
Students examine how he world eats breakfast. In this food choices lesson plan, students work in groups to list breakfast foods and their ingredients and find goods and consumers on the list. The, students use the Internet to complete...
Curated OER
How Much Nutritional Value Does Rice Really Have?
Fifth graders see the nutritional value of rice. In this healthy eating lesson, 5th graders view the Food Guide Pyramid and the number of servings one is supposed to eat in each food group. They focus on rice and its benefits for the body.


