Curated OER
Yam in the Oven
Your vegetable eaters will practice function notation statement interpretation in this short task. These few exercises will bring out misconceptions students may have about function notation as well.
Illustrative Mathematics
Distance across the channel
Here you will find a model of a linear relationship between two quantities, the water depth of a channel and the distance across the channel at water level. The cross section of the channel is the shape of an isosceles trapezoid. The...
Curated OER
Rising Gas Prices – Compounding and Inflation
Financial literacy skills and exponential models are connected by the compound interest formula in this task centered on inflation calculations. Collaborative learners get experience collecting data from the given websites and exploring...
Curated OER
Population and Food Supply
What does it mean for something to grow exponentially, and how does that compare to linear growth? This activity tries to help learners gain an understanding of these concepts while modeling real-world problems. Linear and exponential...
101 Questions
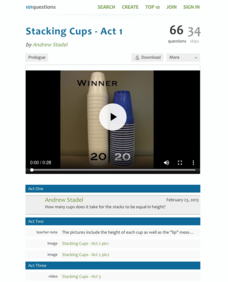
Stacking Cups
Facilitate an understanding of equality using a modeling task. After watching different-sized cups being stacked, learners use their math skills to determine when the height of each cup tower will be the same. Meant as an introduction to...
Illustrative Mathematics
Velocity vs. Distance
At the end of this activity, your number crunchers will have a better understanding as to how to describe graphs of velocity versus time and distance versus time. It is easy for learners to misinterpret graphs of velocity, so have them...
PBL Pathways
Medical Insurance
Design a plan for finding the best health insurance for your money. Learners compare two health plans by writing and graphing piecewise functions representing the plan rules. Using Excel software, they create a technical report...
Curated OER
The Random Walk
Deep mathematical thinking is found with just a coin and a number line. Combining computing some probabilities in a discrete situation, and the interpretation of a function, this simple task gives learners a lot to think about on...
5280 Math
More or Less the Same
Tell the story of the math. Given a graph of a linear system, learners write a story that models the graph before crafting the corresponding functions. Graphs intersect at an estimated point, allowing for different variations in the...
Illustrative Mathematics
Animal Populations
Assume all you know is that the variable Q represents a value that is bigger than the value represented by the variable P. Which is larger P + Q or 2P? The problems in this activity get more complex than...
Illustrative Mathematics
The Sign of Solutions
Positive or negative, zero or no solution, are all possibilities for the solution of a linear equation. Here the resource gives examples of linear equations in one variable and their type of solutions. The resource comes with commentary...
Illustrative Mathematics
Downhill
A car traveling down a steep hill is the model for this resource. The confusion comes when the elevation, E, is given in terms of distance, d. The distance, d, is the horizontal distance from E. Therefore, the equation, E = 7500 – 250d,...
Curated OER
Task: Range of Motion
If you have ever injured your shoulder, you know it takes a while to improve your arm's range of motion. In this real-world example, young mathematicians gain insight into the world of physical therapy while they analyze a case study...
Illustrative Mathematics
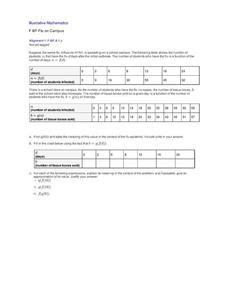
Flu on Campus
An outbreak of the swine flu on a school campus has caused an increase in the number of boxes of tissues sold by the school store. In a real-world-modeling activity, pupils use composition of functions to determine how the number of...
PBL Pathways
Total Cost to Produce the Turbo Blender
Class members blend their knowledge of functions and problem-solving skills to provide business advice to the Turbo Blender manufacturers. Through a project-based approach, learners examine marginal cost data to produce a function....
Illustrative Mathematics
Baseball Cards
Here is a resource that demonstrates growth and the initial state of an equation. For this case, your class will be looking at baseball collections. How many baseball cards did the collector start out with, and how many were added or...
Illustrative Mathematics
Crude Oil and Gas Mileage
Here is an activity that presents a real-world problem about the relationship between crude oil production and the gas mileage of modern automobiles. After learners write functions to describe the relationships, they are asked to...
Illustrative Mathematics
Warming and Cooling
Is it too hot to go hiking? This task asks learners to refer to a graph that shows temperature as a function of time and answer five questions about the scenario depicted by the graph. The exercise could be used for instruction to help...
5280 Math
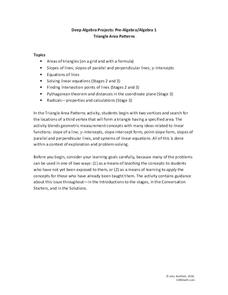
Triangle Area Patterns
Combine algebraic and geometric strategies to find solutions. The task asks learners to find the coordinates of a third vertex of a triangle to create a triangle with a specific area. The project is a set of seven problems that...
Illustrative Mathematics
Bike Race
A graph not only tells us who won the bike race, but also what happened during the race. Use this resource to help learners understand graphs. The commentary suggests waiting until the end of the year to introduce this topic, but why...
Curated OER
Lyrics Statistics
Students describe, analyze and generalize relationships, patterns, functions using words. symbols, variables, tables and graphs.
Curated OER
A Model Solar System
If Earth is modeled by a grapefruit, what planet could be represented by a golf ball? This activity uses everyday and not-so-everyday objects to create a model of the Solar System.
Curated OER
US Population 1982-1988
Your algebra learners make predictions using the concepts of a linear model from real-life data given in table form. Learners analyze and discuss solutions without having to write a linear equation.


