Curated OER
Using Bar Graphs to Understand Voting Patterns
Bar graphs are used as a way to study voting patterns in the United States. A variety of statistical data is presented in the graphs, and pupils must interpret the data in order to make a report to the class. Three excellent graphs,...
Curated OER
Wind Effects- A Case Study
Students explore hurricanes. In this weather data interpretation instructional activity, students draw conclusions about the impact of Hurricane Floyd as it related to weather conditions. Students read and interpret a tide data...
Penguin Books
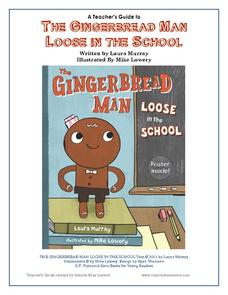
A Teacher's Guide to The Gingerbread Man Loose in the School
What if the Gingerbread Man was trying to catch you, rather than the other way around? Pupils can find out what happens by reading the story The Gingerbread Man Loose in the School by Laura Murray and enrich their experience with the...
Curated OER
Jim Murphy, The Great Fire - Grade 6
The Great Fire by Jim Murphy provides the text for a study of the Chicago fire of 1871. The plan is designed as a close reading activity so that all learners have the same background information require for writing. Richly detailed, the...
The New York Times
The Careful Reader: Teaching Critical Reading Skills with the New York Times
The 11 lessons in this educators' guide focus on using newspapers to develop critical reading skills in the content areas.
National Museum of the American Indian
The A:Shiwi (Zuni) People: A Study in Environment, Adaptation, and Agricultural Practices
Discover the connection of native peoples to their natural world, including cultural and agricultural practices, by studying the Zuni people of the American Southwest. This lesson includes examining a poster's photographs, reading...
Curated OER
Rockefeller's Revenge: Exxon and Mobil Unite
Study the impact and possible outcomes of the Exxon-Mobil merger in your language arts, social studies, or economics class. Secondary learners evaluate a series of graphs, write a paragraph interpreting the data, and engage in class...
Curated OER
Charts, Maps, and Graphs Lesson on the Holocaust
Young scholars practice interpreting data. In this Holocaust lesson, students research selected Internet sources and examine charts, maps, and graphs regarding the Jewish populations in and out of Europe. Young scholars respond to...
Tennessee State Museum
Deciphering the Document: Unlocking the Meaning of the Emancipation Proclamation
Help your learners truly understand the Emancipation Proclamation by asking them the put it into their own words. After reading the document out loud to the class, and briefly discussing the legal language, split your class into small...
Curated OER
Agriculture and the Government
Students study the government's involvement in the U.S. A's food production and make connections relating to farm programs. For this historical agriculture lesson, students read content and research significant information....
Deliberating in a Democracy
Cyberbullying—Alternate Lesson Plan
Should schools be permitted to punish young scholars for off-campus cyberbullying? After reading a passage that details statistics about cyberbullying and Supreme Court rulings about schools' ability to limit student speech,...
Population Connection
Where Do We Grow from Here?
Did you know that the population is expected to grow to 11 billion by 2100? The resource serves final installment in a six-part series on the global population and its effects. Scholars interpret data from the United Nations about the...
ProCon
Gun Control
According to some estimates, there are more guns than people in the United States. Learners decide if America should enact more gun control laws. They analyze information about gun deaths in the United States by year, read about the...
Curated OER
College Education
What do Bill Gates and Mark Zuckerberg have in common? They're both billionaires, and neither one has a college degree! Using the website, scholars explore whether having a college education is truly worth the money it costs. They read...
Curated OER
Geography Skills
Students practice their geography skills. In this geography skills lesson, students locate, plot, and label places on maps and globes.
Curated OER
Canadian Social Trends
Students use surveys to explore how to design graphs, tables, and diagrams. They discuss articles which can stimulate ideas for research topics, or surveys of their own.
Curated OER
How Do I Get There? Planning a Safe Route to School
One much-needed skill for young learners is direction giving. Have your class plan and draw a safe route for them to travel from home to school. They will also draw places and items that are in between home and school in order to build a...
Anti-Defamation League
Women’s Inequity in Pay: Could It Be Sexism, Implicit Bias or Both?
Equal pay for equal work? High schoolers research the reasons for the inequity in women's pay. They read articles, examine graphs, engage in discussion, and then craft an essay in which they suggest a way to address the gender wage gap.
GCSE Modern World History
Mao's China
Here is a great textbook chapter on China's establishment as a communist state in 1949 and the effects of World War II on the nation. The first page prompts learners to complete a timeline activity as they read the material,...
ProCon
Obesity
Is obesity a disease or just a preventable risk factor for other diseases? Scholars attempt to form their own opinions by reading a background of the issue and watching videos that explore the main pro and con arguments using an included...
Curated OER
Corporate Tax Rate and Jobs
Does lowering the corporate tax rate help create jobs in the United States? Learners explore the top pro and con arguments and quotes relating to the issue. They read background information about the creation of the federal corporate...
Curated OER
Then and Now
Students conduct research and use census data to compare different times and places. In this census instructional activity, students interpret data from charts and graphs, comparing census information from two time periods as well as...
Curated OER
Map Making/Floor Plans/Map Reading
Students apply their knowledge of scale when mapping the classroom. They determine the use of a map legend and orient a map using a compass. They create the classroom maps using transfer graph paper.
Curated OER
Twelve Days of Christmas--Prediction, Estimation, Addition, Table and Chart
Scholars explore graphing. They will listen to and sing "The Twelve Days of Christmas" and estimate how many gifts were mentioned in the song. Then complete a data chart representing each gift given in the song. They also construct...


