Concord Consortium
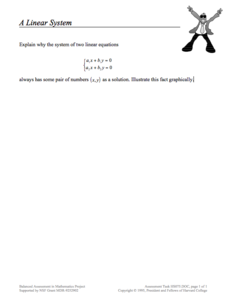
A Linear System
Young mathematicians have the hang of graphing with integer coefficients now. Can they generalize what they've learned to equations with variable coefficients? The task asks individuals to verify the solution to the system is (x,y) and...
Curated OER
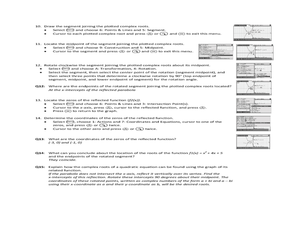
Complex Roots: A Graphical Solution
Using their Ti-Nspire to determine the solutions of parabolas, young scholars explore the concept of complex roots. Students determine if parabolas have real or complex roots. Young scholars determine the the axis of symmetry and the...
Curated OER
Graphic Designing with Transformed Functions
Teach your class how to transform a graph! By identifying the domain and range of the functions, high schoolers can observe the parabola and find the vertex of the transformed graph.
Curated OER
Rate of Change Graphically
Young scholars calculate the rate of change. In this algebra lesson, students identify the slope and discuss the different properties of lines as they relate to rate. A discuss doubling time, zero slope and being in two places at once.
EngageNY
First-Person Computer Games
How do graphic designers project three-dimensional images onto two-dimensional spaces? Scholars connect their learning of matrix transformations to graphic design. They understand how to apply matrix transformations to make...
Shodor Education Foundation
Spinner
Go round and round to compare theoretical and experimental probabilities. Learners set the number of sectors and the number of spins for a spinner. Then, a table displays the experimental and theoretical probabilities of the spinner for...
Curated OER
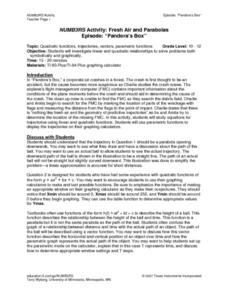
NUMB3RS Activity: Fresh Air and Parabolas
Explore parabolas and investigate linear and quadratic functions to solve problems symbolically and graphically. Also use parametric functions to display trajectories on a graphing calculator.
Curated OER
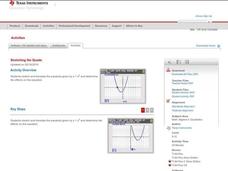
Stretching the Quads
Explore parabolas in this algebra lesson with the graphing calculator. The class investigates what effects the changing of the parameters of the vertex form of a quadrati have to its graph. They find the zeros of a quadratic graphically...
Illustrative Mathematics
Kimi and Jordan
Kimi and Jordan have taken summer jobs to supplement their weekly allowances. Kimi earns more per hour than Jordan, but Jordan's weekly allowance is greater. This activity asks students to determine how the incomes of the two workers...
Chapman University
Graphs of the Sine and Cosine Function in Degrees
This bright, clear, graphic, display of the sin(x) and cos(x) functions spans the domain between -360 degrees and 360 degree. Use it as a poster, handout, presentation slide, or project it onto a whiteboard.
Chapman University
Graphs of the Sine and Cosine Function in Radians
This bright, clear, graphical display of the sin(x) and cos(x) functions spans the domain between -2 pi radians and 2 pi radians. Use it as a poster, handout, presentation slide, or project it onto a whiteboard.
Chapman University
A Pythagorean-Style Proof of the Sine Sum-of-Angles Formula
This well organized poster shows a step-by-step algebraic proof and related graphic. Understanding how formulas were derived, connects learners to the idea that the study of mathematics is continuous and cumulative. Learners will also...
West Contra Costa Unified School District
Connecting Graphing and Solving Absolute Value Equations and Functions
Can you solve an equation graphically? Absolutely! This Algebra II lesson makes the connection between solving an absolute value equation and graphing two functions. Graphing absolute value functions is presented through the process of...
West Contra Costa Unified School District
Introduction to Inverse Functions
Ready to share the beauty of the inverse function with your classes? This algebra II lesson guides the discovery of an inverse function through a numerical, graphical, and an algebraic approach. Connections are made between the three,...
Curated OER
Algebra 2 Desmos Graphing Project
Encourage class members to get creative with functions. Pairs write their names and draw pictures using a graphing application with a collaborative graphic project. The resource provides the requirements for the project, as well as a...
EngageNY
The Definition of a Parabola
Put together the pieces and model a parabola. Learners work through several examples to develop an understanding of a parabola graphically and algebraically.
EngageNY
Rational and Irrational Numbers
Back to the basics: learning how to add numbers. The 17th installment of a 35-part module first reviews addition techniques for rational numbers, such as graphical methods (number line) and numerical methods (standard algorithm). It goes...
EngageNY
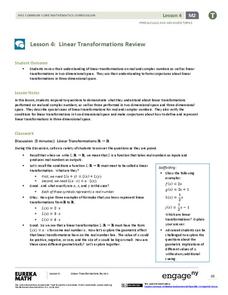
Linear Transformations Review
Time for matrices and complex numbers to come together. Individuals use matrices to add and multiply complex numbers by a scalar. The instructional activity makes a strong connection between the operations and graphical transformations.
EngageNY
Matrix Addition Is Commutative
Explore properties of addition as they relate to matrices. Using graphical representations of vector matrices, scholars test the commutative and associative properties of addition. They determine if the properties are consistent for...
Balanced Assessment
A Run for Two
Develop a graph to represent the distance between two cars. The assessment task presents a scenario in which two cars are traveling at constant speeds with one faster than the other. Pupils develop graphical representations to show the...
CK-12 Foundation
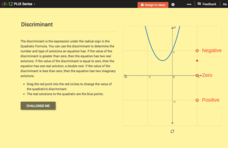
Discriminant
Discriminate between the types of roots. The interactive root introduces the discriminant and its connection to the types and number of roots. Pupils use a slider to view graphically the effect of the sign of the discriminant on a...
CK-12 Foundation
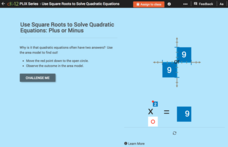
Use Square Roots to Solve Quadratic Equations: Plus or Minus
Get two answers from a single equation. Pupils use the interactive to take the square root of nine and see the graphical representation of the two solutions. Individuals realize that solutions to quadratic equations that are solved by...
CK-12 Foundation
Multiplying Polynomials
Help your class find patterns in polynomial multiplication. Pupils multiply a trinomial by a binomial using a graphic organizer. They respond to questions about patterns observed in polynomial multiplication before a discussion question...
CK-12 Foundation
Evaluate Limits Using Graphs and Tables: Evaluate the Limits
Discontinuities in the graph? No worries. Pupils investigate the limit of a function given graphically using an interactive. The graph has removable and jump discontinuities.
Other popular searches
- Describe Graphically
- Adding Vectors Graphically
- Solving Systems Graphically
- Finding Slope Graphically
- Slope Graphically
- Transformations Graphically
- Solve System Graphically


