Shodor Education Foundation
Graph Sketcher
Sketch graphs with the Graph Sketcher. Scholars graph functions on a coordinate plane. An interactive makes it as easy as inputting the function and clicking a button.
Shodor Education Foundation
Graphit
No graphing calculator? No worries, there's an app for that! Young mathematicians use an app to graph functions. In addition, they can also plot data points.
PHET
Graphing Lines
Ready to increase pupils' understanding of slope with an upward slope? Scholars use an interactive that allows users to move two points on a coordinate plane. The interactive then automatically calculates the slope, the slope-intercept...
Shodor Education Foundation
Function Flyer
Fly through graphing functions with the Function Flyer. Young mathematicians use an interactive to graph different types of functions. A set of exploration questions has users investigate patterns in functions.
Shodor Education Foundation
Conic Flyer
Graphing conics made easy. Individuals use an interactive to graph conic sections. The app can handle circles, vertical and horizontal parabolas, ellipses, and vertical and horizontal hyperbolas.
CK-12 Foundation
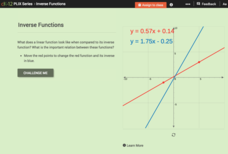
Inverse Functions
Provide a graphical view of inverses. Pupils manipulate points on a line and see the relationship of the graph with the graph of its inverse. Using the relationship between the graphs, scholars respond to questions concerning inverses...
Shodor Education Foundation
Linear Inequalities
An interactive lesson helps individuals learn to graph inequalities in two variables. Scholars can adjust the interactive to present the inequalities in standard or slope-intercept form.
PHET
Forces in 1 Dimension
A realistic simulation uses charts to show forces, position, velocity, and acceleration versus time based on how the simulation is set up. Once those concepts are mastered, scholars use free body diagrams to explain how each graph...
CK-12 Foundation
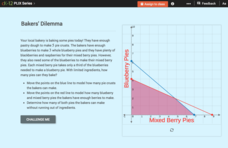
Linear Programming: Bakers' Dilemma
Place the pies in a line. Pupils create a graph of a system of linear inequalities to represent the number of pies a bakery can make. Learners analyze the vertices on the graph to determine the number of pies they can bake without...
Shodor Education Foundation
Sequencer
Take the first step into graphing sequences. Learners set the starting number, multiplier, add-on, and the number of steps for a sequence. Using the inputs, the interactive calculates and plots the sequence on the coordinate plane. Users...
Laboratory for Atmospheric and Space Physics
Marvelous Martian Mineralogy
Believe it or not ... martian soil does have nutrients needed for plants to survive! An out-of-this-world tutorial moves scholars through an analysis of martian soil to determine its chemical make-up. Pupils analyze reflectivity of...
Shodor Education Foundation
Box Plot
What information can come from a box? Learners choose a data set to display as a box plot and decide whether to include the median in the calculation of the quartiles, show the outliers, and change the scale. To finish the lesson,...
Shodor Education Foundation
Two Variable Function Pump
Use a function to operate on two variables. Pupils look at operating with complex numbers as a function of two variables. The interactive squares the input and adds a constant to it. Learners visualize the resulting output and its...
GeoGebra
International Geo Gebra Institute: Geo Gebra
The free mathematics software creates interactive learning material that combines geometry, graphing, tables, algebra, statistics, and calculus. Teachers can download the free open source software to enhance their mathematics lessons. A...
Harvard University
Harvard Smithsonian: Everyday Classroom Tools
The focus of this series of lessons is to engage students in an exploration of the world around them. The emphasis is on inquiry as students learn about the earth, sun, light, shapes and more.


