Concord Consortium
Intersections II
How many intersections can two absolute value functions have? Young scholars consider the question and then develop a set of rules that describe the number of solutions a given system will have. Using the parent function and the standard...
Curated OER
Visualizing Vectors
Investigate vectors in standard positions and use the CellSheet application on the TI calculator to find the sum of two vectors. Convert from polar to rectangular coordinates and vice versa, and show graphs of the vectors.
Curated OER
Basketball Bounces, Assessment Variation 2
This un-scaffold summative assessment tasks learners to use the height of a bouncing basketball, given the data in graph and table form, to choose the model that is represented. Learners then use the model to answer questions about...
Curated OER
Two Points Determine an Exponential Function I
Learners construct an exponential function from a graph, and two given points on the graph, as they analyze what makes up an exponential function.
NOAA
Ocean Layers II
Now that you know the ocean has layers, let's name them. The seventh installment of a 23-part NOAA Enrichment in Marine sciences and Oceanography (NEMO) program covers terminology associated with ocean layers, such as thermocline and...
Radford University
A Change in the Weather
Explore the power of mathematics through this two-week statistics unit. Pupils learn about several climate-related issues and complete surveys that communicate their perceptions. They graph both univariate and bivariate data and use...
CK-12 Foundation
Antiderivative: Piecing it Together
Build a function backwards. Given a graph of the derivative of a function, pupils piece together a graph of the original function, the antiderivative. Learners use their graphs and the graphs of the derivatives to answer questions about...
Mathematics Vision Project
Module 7: Structure of Expressions
The structure of an expression is a descriptive feature. Learners build a solid understanding of quadratic functions using an analysis of expressions in different forms. The seventh module in a series of nine includes 12 lessons...
Curated OER
Abstract painting - Inspired by Textiles
Students compare and contrast various forms of artistic expression associated with specific groups of people, geographic regions, or time periods, specifically art of Andean cultures, and create art works using procedures borrowed from...
Curated OER
Carbon Monoxide and Population Density
Tenth graders investigate the carbon monoxide level at a fixed latitude. They determine if there is a relationship to population density. They download data sets and generate a graph. They determine a link between human activity and...
Curated OER
Impact Craters Activity
Lunar explorers perform an experiment to understand the size of the craters on the surface of the moon. They layer flour, laundry detergent, and cocoa powder in a pan to model the lunar surface. They drop marbles from different heights...
Curated OER
Weather instruments
Students explore weather instruments. In this weather lesson, students make rain gauges, anemometers, and barometers following the instructions given in the lesson. Students set up a weather station using their instruments and record and...
Curated OER
Hyperbolas: Sketching from the Equation
In this algebra worksheet, students sketch graphs of hyperbolas after solving equations to standard form and interpreting the center, vertices, foci, axis, asymptotes, and eccentricity from the equation. There are 58 questions.
EngageNY
Rational and Irrational Numbers
Back to the basics: learning how to add numbers. The 17th installment of a 35-part module first reviews addition techniques for rational numbers, such as graphical methods (number line) and numerical methods (standard algorithm). It goes...
Curated OER
Middle Grades Math: Balancing Equations
Learners solve linear equations. By observing the graph of each side of an equation using the TI-nspire graphing calculator, your class gains insight into solutions, as well as balancing equations and transforming linear equations....
Illustrative Mathematics
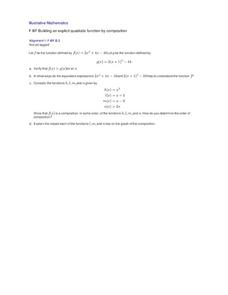
Building an Explicit Quadratic Function by Composition
Use an activity to illustrate the different forms of a quadratic function. Here, the task asks learners to use composition of given functions to build an explicit function. The process emphasizes the impact of the order of...
Bowland
Explorers – Patrol Services
Far out — plan a trip to space! Aspiring mathematicians steer a space vehicle through an asteroid field, calculate currency exchanges to buy provisions, and determine placement of charges to blow up asteroids. Along the way, they learn...
CK-12 Foundation
Domain and Range of a Function: Making Money Math
Graphs are useful for many things, including seeing how much money you can make. Individuals create a graph of earnings from a job based on the number of hours. They determine the domain and range of the graph and answer challenge...
Curated OER
The Scientific Method, Blood Typing, and Antibiotic Resistance
Students are given some components of an experiment, where they are able to identify and fill in missing parts, such as hypothesis, conclusion, results, etc. They form a hypothesis given general scientific facts. Students apply the...
Curated OER
Does Humidity Affect Cloud Formation?
Students use S'COOL data to identify factors that affect cloud formation. They find a data set using the S'COOL database , and use Excel to manipulate the data. Student isolate relevant data, create meaningful graphs from a spreadsheet,...
Curated OER
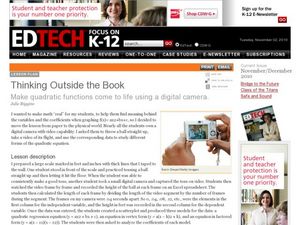
Thinking Outside the Box
Now this lesson sounds fun! High schoolers throw a ball, film it as it soars through the air, and use a spreadsheet to collect data. A scatterplot is created to produce a quadratic regression equation, an equation in vertex form, and an...
Illustrative Mathematics
Building a General Quadratic Function
Rewrite a quadratic function to easily see the transformations involved. The instructional task takes a general quadratic function and rewrites it into a form that shows the translations and scaling of the parent quadratic function. The...
Curated OER
TE Activity: Bubbling Plants
Young scholars study a way to quantify the process of photosynthesis during a given time using the Elodea plant. They design a hypothesis that they test in the hands on activity. They compare the amounts of photosynthesis that occur...
Curated OER
Technology Integration Project Weather Unit Plan
Students use a variety of technology-assisted weather observation tools to observe and record local weather. They identify, measure and record weather conditions, summarize types of clouds and make graphs of their observations. Students...


