University of California
Hot! Hot! Hot!
Calories are not tiny creatures that sew your clothes tighter every night, but what are they? A science lesson, presented at multiple levels, has learners experiment with heat, heat transfer, and graph the function over time....
EngageNY
Linear Functions and Proportionality
Connect linear equations, proportionality, and constant rates of change to linear functions. Young mathematicians learn how linear equations of the form y = mx + b can represent linear functions. They then explore examples of linear...
Curated OER
Basketball Bounces, Assessment Variation 1
This highly scaffolded, summative assessment tasks learners to choose the model that represents the height of a bouncing basketball given the data in graph and table form. Learners then use the model to answer questions about the...
Curated OER
Building a General Quadratic Function
Learners rewrite a general quadratic function by completing the square to see a new form of the function that more easily identifies the x-coordinate of the vertex and the two roots of the function.
Curated OER
Chalk Chromatography
Your chemistry class is sure to love this experiment on column chromatography, as demonstrated with chalk sticks and felt tip markers. Pupils use sidewalk chalk (another inexpensive form of chalk stick) to demonstrate adsorption and the...
PHET
Radiation Hazards in Space
Young scientists race from Earth to Mars and back, trying to complete mission objectives while avoiding radiation in this game for 2-4 players. To identify the winner, players must graph their mission points and radiation points at the...
Curated OER
Algebra I: Linear Functions
Using rates from a rental car company, young mathematicians graph data, explore linear relationships, and discuss the role of slope and the y-intercept. This lesson allows for the discussion of independent and dependent variables, as...
Curated OER
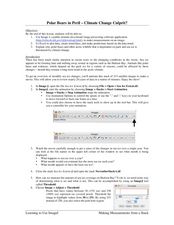
Polar Bears in Peril - Climate Change Culprit?
Students explore the changes in sea ice over several years. In this life science lesson plan, students review and examine 20 years of data. They use Excel to graph data and analyze trends.
Teach Engineering
Can You Resist This?
Some things are hard to resist. Small collaborative groups build circuits and calculate the voltage using Ohm's Law. Budding engineers explore the connection between the voltage across different resistors and linear...
NOAA
Tracking a Drifter
Be shore to use this drifter resource. The third installment of a five-part series has learners using the NOAA's Adopt-a-Drifter website to track to movement of a drifter (buoy) in the ocean. Graphing the collected data on a map allows...
EngageNY
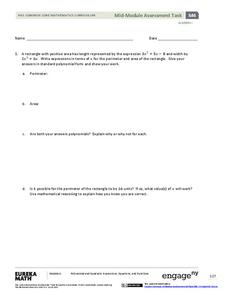
Mid-Module Assessment Task - Algebra 1 (module 4)
Performance task questions are the most difficult to write. Use this assessment so you don't have to! These questions assess factoring quadratics, modeling with quadratics, and key features of quadratic graphs. All questions require...
EngageNY
Comparing Integers and Other Rational Numbers
The ninth installment of a 21-part module has pupils compare integers and rational numbers in decimal and fraction form. They match stories to number lines and compare values in the stories.
ProCon
Gold Standard
If all the mined gold in the world was melted across a football field, it would rise 5.4 feet. That's just one interesting fact pupils learn when using the debate topics website to determine if the United States should return to a gold...
ProCon
Israeli - Palestinian Conflict
Many people think the best solution to the Israeli-Palestinian conflict is a two-state solution. After reviewing the available resources, scholars determine whether they agree with that approach. They analyze graphs and charts about...
Baylor College
Lungometer
Life science learners construct lung-o-meters from gallon-sized milk jugs and then measure their lung capacities. For older students, have them graph the vital lung capacities of each person in the class. Cross-curricular pieces are...
Mathematics Vision Project
Quadratic Functions
Inquiry-based learning and investigations form the basis of a deep understanding of quadratic functions in a very thorough unit plan. Learners develop recursive and closed methods for representing real-life situations,...
Benjamin Franklin High School
Saxon Math: Algebra 2 (Section 4)
This fourth of twelve units in a series continues the investigation of functions through equations and inequalities. However, the modular nature of the lessons in the section make this an excellent resource for any curriculum...
McGraw Hill
Planetary Variations Interactive
Planetary atmospheres vary greatly from planet to planet. Explore these variations by experiencing the motion of the atmospheric molecules through an engaging simulation. Pupils discover that temperature and mass contribute to...
CK-12 Foundation
Determining the Equation of a Line: Temperature Conversion Challenge
Line up the temperature conversions. Pupils create the linear function between Celsius and Fahrenheit on a graph by plotting the freezing and boiling points of water. The scholars determine how the relationship changes based upon...
CK-12 Foundation
Complement Rule for Probability: Changes in an Election
Pupils determine the probability of one mayoral candidate winning given the other's chance. The interactive provides a circle graph to help visualize each candidate's percentages of winning.
CK-12 Foundation
Linear and Non-Linear Function Distinction: Domain and Range of a Function
Functions are special types of relations, but what makes them so special? Pupils use an interactive to slide a vertical line across six different graphs. Ten challenge questions then assess understanding of functions.
CK-12 Foundation
Algebraic Functions: Vertical Line Test
To be (a function) or not to be (a function). An easy-to-use interactive has pupils drag a vertical line onto several graphs to determine if they represent functions. Some challenge questions assess understanding of this idea.
CK-12 Foundation
Systems of Linear Inequalities: Baking Cookies
Cook up a good resource for systems of linear inequalities. Using an interactive, individuals graph a system of linear inequalities to represent constraints on the number of cookies a person must bake. A set of challenge questions...
CK-12 Foundation
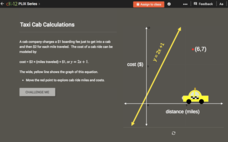
Checking Solutions to Equations: Taxi Cab Calculations
Ride to success in checking solutions to equations. Scholars use an interactive graph to identify points that are solutions to a linear equation. Interpreting these points in terms of the context completes the activity.


