PBL Pathways
Death Project
Verify the rule of thumb for finding the time of death. The project-based learning task asks pupils to determine when the rule of thumb process of finding the time of death is appropriate. Learners develop a function for the rule and...
CK-12 Foundation
Graphs of Absolute Value Equations: Absolute Value Distance
The sole purpose of this interactive is to graph a function representing the distance of a car from a shoe store. Scholars use an interactive to graph such an absolute value function. They then answer a set of challenge questions...
CK-12 Foundation
Function Rules based on Graphs: Making Money in the Hat Business
Hats off to those learning about the graphs of functions. Individuals use an interactive to plot points representing profits for a hat business. They identify a quadratic equation to represent this function and answer challenge questions...
K20 LEARN
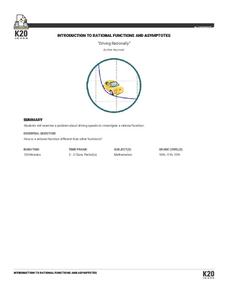
Driving Rationally: Introduction To Rational Functions And Asymptotes
Calculating average speeds is not as simple as finding an average. The lesson introduces class members to rational functions by presenting a problem about finding an average speed for the rest of a trip. Pupils develop an equation to...
Curated OER
Graphing Lines by Graphing Two Points
Use a graphing lines instructional activity to have your mathematicians graph the line of a given equation and plot specified points. The first 10 problems have a given equation, and two values. The next 10 problems have a given...
Radford University
Transformational Graphing in the Real World: Bacteria – Growth or Decay?
Grow—not decay—your knowledge of exponential functions. Young mathematicians graph exponential functions and explore how transformations affect the graphs. They decide whether the functions represent growth or decay in the context of...
CK-12 Foundation
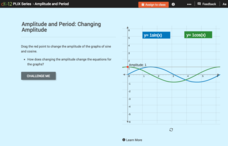
Sine Graph and Cosine Graph: Changing Amplitude
Scholars manipulate the amplitude of the graphs of sine and cosine, notice how the change in amplitude is reflected in their graphs, and answer several questions about the concept they noticed.
Flipped Math
Sketching Polynomial Functions
Provide a sketch of the suspect. Scholars see how to use the key aspects they know about polynomials to create a sketch of the graph. Learners factor to calculate the zeros by factoring, find the end behavior, and determine the...
CK-12 Foundation
Quadratic Functions and Equations
The form of a quadratic function paints a picture of its graph. Young mathematicians explore this connection by locating key features on a graph and then writing the corresponding equations. The interactive tutorial highlights key...
CK-12 Foundation
Quadratic Functions and Their Graphs: Soccer Ball Trajectory
Determine critical points in the flight of a soccer ball. Pupils use an interactive resource to find the vertex and x-intercepts of the graph of the trajectory of a soccer ball after being kicked. Scholars investigate the trajectory...
CK-12 Foundation
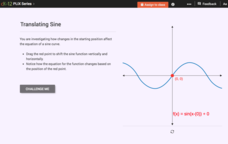
Translating Sine and Cosine Functions: Translating Sine
Learn how to slide sine back and forth and up and down. Pupils move the starting point of a graph of sine vertically and horizontally. They investigate the changes to the equation of the graph in relationship to the translation. They...
CK-12 Foundation
Domain and Range of a Function: Making Money Math
Graphs are useful for many things, including seeing how much money you can make. Individuals create a graph of earnings from a job based on the number of hours. They determine the domain and range of the graph and answer challenge...
CK-12 Foundation
Existence: One-to-One Functions and Inverses
One-to-one means the answer is simple, right? Given four graphs, pupils use a vertical line to test each graph to find out if they are one-to-one. By using the resource, learners realize that not all one-to-one relations are functions....
Mathematics Vision Project
Module 4: Polynomial Functions
Bridge the gap between graphical and algebraic representations. Learners complete six lessons that begin by pointing out connections between the key features of a polynomial graph and its algebraic function. Later, pupils use the...
CK-12 Foundation
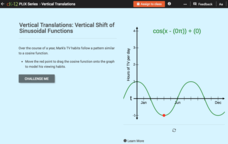
Vertical Translations: Vertical Shift of Sinusoidal Functions
Create a shift in TV viewing habits. The interactive presents a cosine model of an individual's TV viewing habits during a year. Class members move the model to reflect given conditions. Finally, they determine key features from the...
Radford University
Transformational Graphing in the Real World: Air Traffic Control
You're cleared to learn about absolute value functions. An interesting lesson has scholars investigate transformations of the graphs of absolute value functions. They look at air traffic control as an application of the concept.
EngageNY
End Behavior of Rational Functions
Connect end behavior to previous learning. Pupils connect finding the end behavior of rational functions to finding end behavior of polynomial functions. The 13th segment in a 23-part unit starts with finding the end behavior or power...
CK-12 Foundation
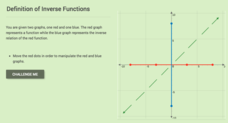
Definition of Inverse Functions
Investigate the definition of inverse functions graphically. Using the interactive, scholars create a graph of a function and view its resulting inverse. They then determine whether a group of functions have inverses that are also...
CK-12 Foundation
Linear and Non-Linear Function Distinction: Domain and Range of a Function
Functions are special types of relations, but what makes them so special? Pupils use an interactive to slide a vertical line across six different graphs. Ten challenge questions then assess understanding of functions.
EngageNY
Inverse Functions
Undo the functions. Learners refresh their knowledge of inverses of functions from Algebra II in the 19th section of a 23-part Precalculus unit. Pupils look at inverses in tables and graphs. They then add to their understanding of...
Radford University
Fuel Efficient Function Activity
Pupils research the five most fuel efficient vehicles of the same type and come up with a way to display the mile per gallon for each vehicle. After choosing a vehicle, scholars create graphs to display miles traveled given the amount of...
Curated OER
Functions and the Vertical Line Test
Students examine functions and function notation. They use computer activities to discover how to graph functions, and conduct a vertical line test. Students describe spatial relationships using coordinate geometry.
Curated OER
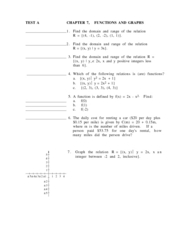
Chapter 7. Functions and Graphs
In this functions and graphs activity, students determine the domain and range of a given relation. They graph functions on a coordinate plane and write equations in the slope-intercept form. This twelve page activity...
Curated OER
Exercise Set 1.5: Inverse Functions
In this inverse functions worksheet, young scholars review inverse functions. They solve 66 questions. Problems cover a wide variety of types. Students graph functions and their inverses, they identify one-to-one functions and the...
Other popular searches
- Algebra Graphing Functions
- Exploring Graphing Functions
- Graphing Nonlinear Equations
- Functions and Graphing


