EngageNY
Graphs of Simple Nonlinear Functions
Time to move on to nonlinear functions. Scholars create input/output tables and use these to graph simple nonlinear functions. They calculate rates of change to distinguish between linear and nonlinear functions.
Willow Tree
Graphing
So many methods and so little time! The efficient method of graphing a linear equation depends on what information the problem gives. Pupils learn three different methods of graphing linear equations. They graph equations using...
Illustrative Mathematics
Function Rules
Function machines are a great way to introduce the topic of functions to your class. Here, you will explore the input and output to functions both using numerical and non-numerical data. Learners are encouraged to play with different...
Willow Tree
Linear Relationships
There's just something special about lines in algebra. Introduce your classes to linear equations by analyzing the linear relationship. Young mathematicians use input/output pairs to determine the slope and the slope-intercept formula to...
EngageNY
Comparing Linear Functions and Graphs
How can you compare linear functions? The seventh installment of a 12-part module teaches learners how to compare linear functions whose representations are given in different ways. They use real-world functions and interpret features in...
EngageNY
Comparing Rational Expressions
Introduce a new type of function through discovery. Math learners build an understanding of rational expressions by creating tables and graphing the result.
Illustrative Mathematics
US Garbage, Version 1
An interesting example of a discrete function and how it is applies to the real world. This could easily make a good collaborative lesson with an environmental science class. Practice reading a table and drawing a scatter plot make up...
EngageNY
The Height and Co-Height Functions of a Ferris Wheel
Show learners the power of mathematics as they model real-life designs. Pupils graph a periodic function by comparing the degree of rotation to the height of a ferris wheel.
Project Maths
Introduction to Patterns
The world is full of patterns. Help learners quantify those patterns with mathematical representations. The first Algebra lesson in a compilation of four uses a series of activities to build the concept of patterns using multiple...
Curated OER
Interactivate: Introduction to Functions
This interactive website provides a variety of lesson plans according to which standards you are applying and which textbook you use. Introduce functions to your class by having them construct single operation machines and create...
California Mathematics Project
Viral Marketing
Math's gone viral—in the form of an exponential function! The activity uses an exponential function to model the growth of a marketing strategy. Learners create a table of values to observe the pattern in the numbers and then model the...
Pennsylvania Department of Education
What is the Chance?
Fourth and fifth graders make predictions using data. In this analyzing data lesson plan, pupils use experimental data, frequency tables, and line plots to look for patterns in the data in order to determine chance. You will need to make...
EngageNY
Graphs of Linear Functions and Rate of Change
Discover an important property of linear functions. Learners use the slope formula to calculate the rates of change of linear functions. They find that linear functions have constant rates of change and use this property to determine if...
Curated OER
Making Connections
Eighth graders investigate the input/output model for building function tables. From the data, 8th graders connect tables, graphs, function rules, and equations in one variable. They work backwards to determine function rules for given...
Wordpress
Introduction to Exponential Functions
This lesson begins with a review of linear functions and segues nicely over its fifteen examples and problems into a deep study of exponential functions. Linear and exponential growth are compared in an investment task. Data tables are...
West Contra Costa Unified School District
Multiple Representations of Equations
class members first work through finding the equation, table of values, graph, and key features of a linear function expressed verbally. Individuals then work through several more problems given different representations.
Curated OER
Graphing Linear Equations with Calculator
Students graph lines using the calculator. In this algebra lesson, students graph lines of equations in the form y=mx+b. They input equations into the TI Calculator and graph using the slope and intercept. They analyze the graph for...
Curated OER
Function-al Machines and Spaghetti Graphs
Sixth graders identify the relationship between patterns and functions. In this algebra instructional activity, 6th graders use a "Functional Machine" to identify the rule. Students use a function table to plot the points using play...
Curated OER
Graphing Linear Functions
Seventh graders identify the use of a function.They are asked to describe the input and output of a function. Students also identify different aspects of the coordinate system and represent functions in a visual graph.
EngageNY
Motion Along a Line – Search Robots Again
We can mathematically model the path of a robot. Learners use parametric equations to find the location of a robot at a given time. They compare the paths of multiple robots looking for parallel and perpendicular relationships and...
Curated OER
Functions and Their Graphs.
Students solve equations and label it as a function or not. In this algebra lesson, students make a table of values and graph their equation. They identify the domain and range of each graph.
Curated OER
Function Tables
Students identify function using tables of data. In this algebra instructional activity, students create a tale of point and plot on a coordinate plane. They analyze the graph as being a function or not.
Illustrative Mathematics
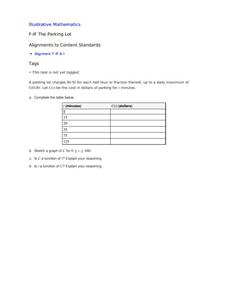
The Parking Lot
Use the real-world cost of parking a car to demonstrate the properties of a function. The resource describes to learners how much it is to park in a certain lot. It is up to your number crunchers to complete a table of minutes and...
Curated OER
A Sum of Functions
Collaborative learners will see the geometric addition of functions by graphing the sum of two graphed curves on the same coordinate plane. This task then naturally flows into giving learners the algebraic representation of the curves...


