Physics Classroom
Using Graphs
Many university professors complain incoming scholars struggle with interpreting graphs. A skill builder offers three different types of exercises including calculating slope, interpreting graphs, and extrapolating outside the plotted...
Laboratory for Atmospheric and Space Physics
Science at 100,000 Feet
Take your class up, up, and away with an engaging weather balloon simulation! Individuals get hands-on experience in creating and launching their own airborne labs to study how temperature and pressure affect substances at 100,000...
Scholastic
Study Jams! Sound
Listen in as Mia and Sam expound on sound. It is caused by vibrations and travels in waves. It has the qualities of pitch, frequency, and volume. This hip animation displays a graph to depict the frequency and amplitude of sound waves....
Shodor Education Foundation
Graph Sketcher
Sketch graphs with the Graph Sketcher. Scholars graph functions on a coordinate plane. An interactive makes it as easy as inputting the function and clicking a button.
Physics Classroom
Position-Time Graphs - Conceptual Analysis
Increasingly, colleges and employers want applicants with strong conceptual analysis skills, so give them some practice! Applying these skills to position-time graphs encourages synthesis of knowledge. To complete an installment of a...
Concord Consortium
Specific Heat and Latent Heat in Condensation
There's more to melting than meets the eye! Junior physical chemists investigate the differences between specific and latent heats as a substance undergoes a phase change. Users remove heat from the system and observe changes in kinetic...
Physics Classroom
Position-Time Graphs
Three sections review the key skills covered in a series on dimensional kinematics. The first covers the difference between distance and displacement. The second addresses the relationship between velocity and slope. The third includes...
Learning Games Lab
Scientific Graph Reading
Interpreting graphs is an essential skill for young scientists. An interactive online lesson gives individuals an opportunity to review the components of a graph and learn to read and interpret the shape of a graph. The lesson includes...
Learning Games Lab
The Magic of Reading Graphs
Making conclusions from graphs doesn't need to seem like magic. Learners explore an interactive lesson on reading graphs to strengthen their skills. The content discusses how to read the axes of a graph and draw conclusions based on the...
Shodor Education Foundation
Graphit
No graphing calculator? No worries, there's an app for that! Young mathematicians use an app to graph functions. In addition, they can also plot data points.
Shodor Education Foundation
Linear Inequalities
An interactive lesson helps individuals learn to graph inequalities in two variables. Scholars can adjust the interactive to present the inequalities in standard or slope-intercept form.
Shodor Education Foundation
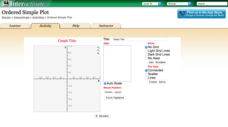
Ordered Simple Plot
Open your imagination to make algebra-inspired creations. An interactive lesson has scholars graph images from a set of parameters. Users can practice minimum values, maximum values, and scale as well as key features.
Laboratory for Atmospheric and Space Physics
Star Light, Star Bright
Star light, star bright, first star I see ... wait a minute, where did the star go? Scholars complete a simulation that measures the brightness of a distant star as another object passes in front of it. Learners move the passing...
Shodor Education Foundation
Function Flyer
Fly through graphing functions with the Function Flyer. Young mathematicians use an interactive to graph different types of functions. A set of exploration questions has users investigate patterns in functions.
Shodor Education Foundation
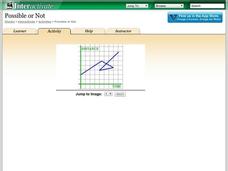
Possible or Not?
What does the graph mean? Pupils view 10 graphs and determine whether they are possible based on their contexts. The contexts are distance versus time and profit versus time.
Howard Hughes Medical Institute
Mass Extinctions Interactive
Extinctions constantly occur, but what sets off a mass extinction event? Young scientists study the data from the previous five mass extinctions to better understand their causes. Then, they learn the impact each extinction had on our...
NOAA
Subduction Zones
Sink into an interactive learning experience about subduction zones! Junior oceanographers examine the earth-shaking and earth-making effects of subduction in the fourth installment in a 13-part series. Hands-on activities include...
Biology in Motion
Evolution Lab
Evolution occurs though change over time, but can it go any faster? Scholars speed up the process of evolution and observe a simulation of 20 blue organisms fighting for survival. A graph displays the changes in phenotype over time. By...
Shodor Education Foundation
Conic Flyer
Graphing conics made easy. Individuals use an interactive to graph conic sections. The app can handle circles, vertical and horizontal parabolas, ellipses, and vertical and horizontal hyperbolas.
Shodor Education Foundation
Multi-Function Data Flyer
Explore different types of functions using an interactive lesson. Learners enter functions and view the accompanying graphs. They can choose to show key features or adjust the scale of the graph.
Shodor Education Foundation
Plop It!
Build upon and stack up data to get the complete picture. Using the applet, pupils build bar graphs. As the bar graph builds, the interactive graphically displays the mean, median, and mode. Learners finish by exploring the changes in...
Shodor Education Foundation
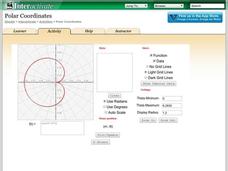
Polar Coordinates
Polar opposites might not work together—but polar coordinates do! The interactive provides learners the opportunity to graph trigonometric and algebraic functions using polar coordinates. The program takes either individual data points...
Concord Consortium
Pendulum and Spring
Up, down, back, and forth. When you make a pendulum out of a spring, there's a lot to observe. Aspiring masters of motion examine the combined kinetic energies of spring and pendulum motion using a detailed interactive. Learners observe...
Concord Consortium
Double Pendulum
What's better than a pendulum for studying motion and periods? A double pendulum! Young physical scientists use an interactive to explore pendulum motion—times two. The resource boasts a host of parameters to change and a running graph...


