Balanced Assessment
Multi-Graphs
So many things change as time goes by. Here, scholars create graphs based on this premise. Each problem asks pupils to sketch a graph that describes a given situation. Their graphs represent various characteristics such as height,...
NASA
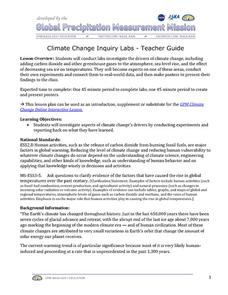
Climate Change Inquiry Lab
With global temperatures on the rise faster than ever recorded, the effects of a heating planet could be devastating. Allow learners to discover just what the world is in store for if the warming continues through a series of videos, a...
Nuffield Foundation
Intrepreting Information about Sweating and Temperature
Why do we sweat? Scholars analyze data about body temperature, sweating, and other factors to better understand sweating. They note the changes after drinking ice water to sweating, skin temperature, and body temperature. Analysis...
CK-12 Foundation
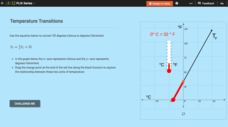
Linear Equations: Temperature Transitions
Explore linear conversions using an engaging interactive lesson. Learners drag a point on a graph to discover the equivalent degrees in Fahrenheit and Celsius. Embedded questions highlight key features such as slope and the y-intercept.
NASA
Comparing Temperature and Solar Radiation for Common Latitudes
There's snow much to learn! Excited individuals use real-world data to discover how latitude affects the odds of a snow day. Scientists compare latitude, solar radiation, and temperature using NASA data for several locations....
Curated OER
Global Warming Statistics
Young scholars research and collect data regarding temperature changes for a specific location and find the mean, median, and mode for their data. For this climate change lesson, students choose a location to research and collect data...
Curated OER
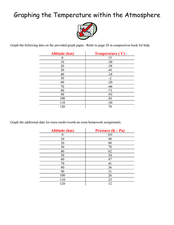
Graphing the Temperature within the Atmosphere
Musing meteorologists design graphs of the temperature and pressure changes for altitude increase in our atmosphere. The activity is pertinent to middle school earth science curriculum. Vary the type of homework you assign when teaching...
McAuliffe-Shepard Discovery Center
Global Warming in a Jar
This well-organized lab activity introduces earth science pupils to the greenhouse effect. They will set up two experiments to monitor temperatures in an open jar, a closed jar, and a closed jar containing water. Ideally, you would have...
US Environmental Protection Agency
Carbon Through the Seasons
Meteorologists view an animated video by the Environmental Protection Agency to learn how the carbon cycle works, and then move into groups to analyze and graph actual data of the atmospheric carbon dioxide concentration from Hawaii's...
NASA
The Big Climate Change Experiment Lesson 3: Climate Change Lines of Evidence
Consider the preponderance of evidence when making a verdict. The third of five lessons in Unit 1: The Big Climate Change Experiment focuses on the evidence for climate change. Learners study graphs, diagrams, and pictures regarding...
Curated OER
Gasoline Additive
Chemists consider a situation in which an ethanol producer needs to determine how much to add to t-butanol to prevent freezing during transport. They work in the laboratory to obtain the freezing point depression constant for the...
Curated OER
A Sweet Drink
Young scholars investigate reaction rates. In this seventh or eighth grade mathematics instructional activity, students collect, record, and analyze data regarding how the temperature of water affects the dissolving time of a sugar...
Chicago Botanic Garden
GEEBITT (Global Equilibrium Energy Balance Interactive TinkerToy)
Students use the GEEBITT excel model to explore how global average temperatures are affected by changes in our atmosphere in part two of this series of seven lessons. Working in groups, they discuss, analyze graphs, and enter data to...
Center for Learning in Action
Water—Changing States (Part 1)
Here is part one of a two-part lesson in which scholars investigate the changing states of water—liquid, solid, and gas. With grand conversation and up to three demonstrations, learners make predictions about what they think will happen...
Curated OER
Specific Heat and Insulation - Temperature Changes
Young scholars expand their knowledge of how temperature changes between air and soil. They also examine how natural grass cover insulates the effects of the sun's direct radiation.
Curated OER
The Effect of Temperature on Cricket Chirping
High schoolers examine the effect of temperature on how often crickets chirp. In groups, they complete the experiment and answer lab discussion questions. They create a graph of temperatures and the amount of chirps and discuss the results.
Curated OER
A Comparison of Land and Water Temperature
Students examine NASA satellite observations of surface temperature and investigate the seasonal changes of land and water temperature.
Curated OER
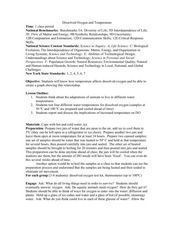
Dissolved Oxygen and Temperature
Young scholars are shown how temperature affects dissolved oxygen and they create a graph showing this relationship. They think about the adaptations of animals to live in different water temperatures. Students test four different water...
Curated OER
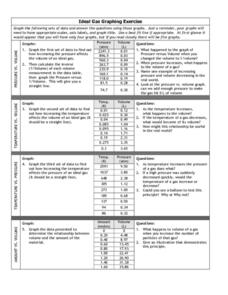
Graphing Exercise of Ideal Gas Data
In this graphing of Ideal Gas Data worksheet, learners use the given data to draw 4 graphs of the given data. They are given the pressure and volume to draw and interpret the graphs.
Curated OER
Linkages Between Surface Temperature and Tropospheric Ozone
High schoolers use data microsets of mean near-surface air temperature and tropospheric ozone residual averages to infer patterns. Students analyze changes in tropospheric ozone and then hypothesize about the consequences of these changes.
Curated OER
Weather, Sea Level Rise and Climate Change
Students differentiate weather and climate. In this earth science lesson, students compare weather and climate in different regions of the world. They interpret weather graphs and compare isotherm lines of northern and southern hemisphere.
Curated OER
Using Graphs
Print and use this useful unit on basic algebraic functions, domain, range, and graphing. Tasks include, illustrating simple functions with a graph, and identifying the domain and range of the function. This twelve-page packet contains...
Curated OER
Ice Cream Lab
I scream, you scream, we all scream for ice cream! Even high schoolers enjoy making ice cream. This laboratory exercise has them record the temperature changes throughout the process of liquid becoming solid, graph the results, and...
Mr. E. Science
Changes in Matter
Do solids, liquids, and gases even matter? The presentation focuses on changes in matter, including phases, Boyle's Law, Charles' Law, and physical changes.


