Curated OER
Graphs of the Sine and Cosine Function
In this college level Pre-Calculus worksheet, students investigate the graphs of the sine and cosine functions. The six page worksheet contains seventy-eight problems. Solutions are not provided.
Curated OER
Chapter 10 - Objective 6.1 Graph
In this graphing activity, students solve linear and parabolic equations and graph equations on a coordinate plane. They use the discriminant to determine the number of x-intercepts of a parabola. This one-page activity contains ten...
Curated OER
Graphing Linear Equations
Ninth graders review the information that they have already learned
with regard to linear equations and graphical representations. They then assist in combining equations with a graphical element and complete various graphs with this...
Curated OER
Topic 2.3 - Slope
In this slope intercept activity, students solve 15 problems in which they find the slope of a linear equation, the slope of a graph, the slope using 2 points, and the equation of a line parallel or perpendicular to a given line.
Curated OER
Writing Linear Equations
In this linear equations activity, learners observe a graphed line on a coordinate plane. From their observations, they write the slope-intercept form of the equation of the depicted line. This four page activity contains eight...
Curated OER
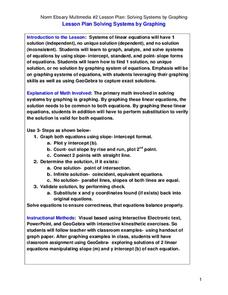
Solving Systems by Graphing
Students solve systems of equation through graphing. In this algebra lesson plan, students solve linear equations and analyze the result to figure out if there is one solution, no solution or infinitely many solutions. They graph their...
Curated OER
Lines of Slope
In this lines of slope worksheet, 9th graders solve and complete 40 various types of problems. First, they find the equation of the lines described and write in slope-intercept form. Then, students graph each equation. They also find the...
Curated OER
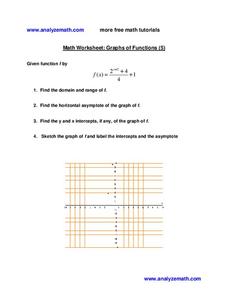
Graphs of Functions
In this algebra activity, 11th graders graph functions and identify properties of each functions. They find the domain and range, along with the asymptote. There are 4 questions on this activity.
Curated OER
Graphing Linear Inequalities
For this graphing linear inequalities worksheet, students graph 1 linear inequality. Students walk through each step to graphing the inequality and shading the appropriate region on the graph.
Curated OER
Solving Systems of Equations by graphing for Algebra One
Students watch the teacher demonstrate on an overhead projector how to graph various equations before the students try them on their own. They start with pencil and paper; once they grasp the concept they move on to punching in the...
Curated OER
Parabola
In this parabolas activity, 10th graders solve and graph 12 different problems related to various types of parabolas. First, they determine the vertex and the y-intercept based on the graph illustrated for each. Then, students write a...
Curated OER
Rational Functions
In this algebra worksheet, students solve rational functions and identify the x and y intercepts, the vertical and horizontal asymptotes. There are 26 questions.
Curated OER
Using Linear Models
For this Algebra II worksheet, 11th graders examine models whose behavior can be described by a linear function. The four page worksheet contains explanation of topic, three guided problems, and eight practice problems. ...
University of Texas
A Library of Parent Functions
Don't think this lesson is for Mom and Dad; parent functions are all for your high schoolers. Flip through a presentation with a focus slide on each type of graph and its characteristics. Some examples are included but the...
Mathematics Vision Project
Module 4: Rational Functions
Time to study the most sensible function — rational functions! The seven-lesson unit develops the concept of a rational function through a connection to rational numbers and fractions. Scholars graph functions, solve equations, and...
Willow Tree
Linear Relationships
There's just something special about lines in algebra. Introduce your classes to linear equations by analyzing the linear relationship. Young mathematicians use input/output pairs to determine the slope and the slope-intercept formula to...
Illustrative Mathematics
Proportional Relationships, Lines, and Linear Equations
The resource is a good introduction to what makes a proportional relationship between two lines. Discuss the similarities of both lines and the possibility of intersection. Use this opportunity to list other acceptable forms of each...
West Contra Costa Unified School District
Shifting Linear Equations in Function Notation
Time for a shift in thinking! Learners examine translations of linear functions. They use function notation to describe the translation and make connections to the graph.
Math-U-See
Extra Practice
From exponents to slope-intercept form, an array of extra practice exercises will reinforce necessary skills for your middle and high schoolers. The worksheets include practice with order of operations, graphing equations, scientific...
Curated OER
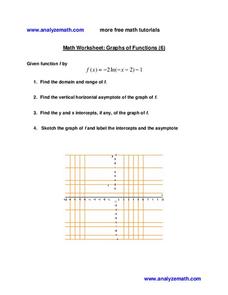
Graphs of Functions
In this graphs of functions worksheet, students identify the domain and range of a function. They determine the vertical horizontal asymptote and find the y and x intercepts. Students sketch a graph of the function. This one-page...
Curated OER
Graphs of Functions
In this algebra worksheet, 11th graders calculate the domain, range, asymptote and intercepts of a quadratic function. They sketch the graph and identify the transformation. There are 4 questions in this worksheet.
Curated OER
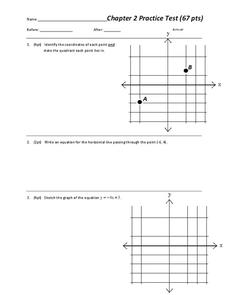
Chapter 2 Practice test
Overall, this worksheet contains a good selection of problems that reviews different aspects of linear equations. Learners examine and graph linear equations, absolute value equations, and inequalities in two variables. The three page...
Curated OER
Math Mediator Lesson 10: Slope
Students explore the concept of slope. In this Algebra I lesson, students investigate the definition of slope as rise over run or change in y compared to change in x. The lesson includes a real-world problem in which the...
Curated OER
Linear Equations Data Tables
Students graph linear equations on a Cartesian plane. After describing data tables and their use, students explore how the information from a table can be used to create a line graph. They discuss reasons for plotting a minimum of...


