American Statistical Association
What Fits?
The bounce of a golf ball changes the result in golf, mini golf—and a great math activity. Scholars graph the height of golf ball bounces before finding a line of best fit. They analyze their own data and the results of others to better...
Curated OER
Building a General Quadratic Function
Learners rewrite a general quadratic function by completing the square to see a new form of the function that more easily identifies the x-coordinate of the vertex and the two roots of the function.
Curated OER
Data and Scientific Graphs
Students conduct experiments and graph their data. In this statistics lesson, students collect data and graph it on a coordinate plane. They analyze the data looking for patterns and they discuss their findings with the class.
Texas Instruments
2B or not 2B a Functions
Learners use their graphing calculators to view graphs of equations. They tell if each equations is or is not a function and are shown pre-set graphs on their graphing calculators. They use the Quick Poll feature to indicate if the graph...
EngageNY
The Computation of the Slope of a Non-Vertical Line
Determine the slope when the unit rate is difficult to see. The 17th part of a 33-part series presents a situation that calls for a method to calculate the slope for any two points. It provides examples when the slope is hard to...
Shodor Education Foundation
InteGreat
Hands-on investigation of Riemann sums becomes possible without intensive arithmetic gymnastics with this interactive lesson plan. Learners manipulate online graphing tools to develop and test theories about right, left, and midpoint...
Curated OER
Rainbows, Bridges & Weather, Oh My!
Explore how real-world applications can be parabolic in nature and how to find quadratic functions that best fit data. A number of different examples of modeling parabolas are explored including a student scavenger hunt, the exploration...
Curated OER
Reading Graphs
Students practice plotting functions on the Cartesian coordinate plane, see several categories of functions, including lines and parabolas, and read a graph, answering questions about the situation described by the graph
Curated OER
Hand Span and Height
Is there a relationship between hand span width and height? Statisticians survey each other by taking measurements of both. A table that can hold data for 24 individuals is printed onto the worksheet, along with questions for analysis....
EngageNY
The Slope of a Non-Vertical Line
This activity introduces the idea of slope and defines it as a numerical measurement of the steepness of a line. Pupils then use the definition to compare lines, find positive and negative slopes, and notice their definition holds for...
EngageNY
Mid-Module Assessment Task: Grade 8 Module 6
Make sure pupils have the skills to move on to the second half of the module with a mid-module assessment task. The formative assessment instrument checks student learning before moving on to the rest of the lessons in the unit.
Houghton Mifflin Harcourt
Unit 4 Math Vocabulary Cards (Grade 6)
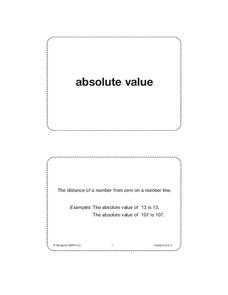
Reinforce math vocabulary with a set of flash cards. Forty-eight cards offer boldly printed words, and their corresponding definition alongside an example with labels. Terms include absolute value, inverse operations, slope, and more!
Curated OER
Comparing Value for Money: Baseball Jerseys
Learners step up to the plate as they first complete an assessment task using linear equations to determine the best company from which to buy baseball jerseys. They then evaluate provided sample responses identifying strengths and...
Mathematics Assessment Project
Matching Situations, Graphs and Linear Equations
What do guitars, candles, and helicopters have in common? They're all in this resource. Learners complete an assessment task to determine the amount of profit made in a guitar class based on given information regarding variable...
Curated OER
Another Way of Factoring
Focusing on this algebra lesson, learners relate quadratic equations in factored form to their solutions and their graph from a number of different aspects. In some problems, one starts with the original equation and finds the solutions....
Curated OER
Race Track (Culminating Activity)
Young scholars graph and solve linear equations. In this algebra lesson, students use the slope and y-intercept to graph lines. They relate lines to the real world using different applications.
Curated OER
Basic Algebra and Graphing for Electric Circuits
In this electronics worksheet, students evaluate mathematical expressions to complete 16 short answer and problem solving questions.
Curated OER
Reading Graphs
Students plot functions on the Cartesian coordinate plane. They explore lines and parabolas. Students analyze graphs and answer questions about the information presented on the graph using an online program.
Curated OER
Walk the Line
Learners create constant speed versus motion graphs. They will perform linear regressions on their data to describe the graphs mathematically.
Curated OER
Lessen the Loan
Middle-schoolers explore the concept linear equations. They use the internet to navigate through videos and problems. Pupils problem solve to determine rates of change, slope, and x and y-intercepts.
Curated OER
Highs and Lows
Solve problems using integration and derivatives. By using calculus, learners will analyze graphs to find the extrema and change in behavior. They then will identify the end behavior using the derivatives. Activities and handouts are...
Curated OER
Direct and Inverse Variation
Eighth graders participate in two data collection activities that involve direct and inverse variation. In the pre-assessment, 8th graders categorize numerical, graphical, and verbal representations as linear or nonlinear and determine...
Curated OER
Graphing and the Coordinate Plane
Students examine the four quadrants of Cartesian coordinate plane. They play maze games and coordinate games to discover how to read and plot points on the plane. Students plot points on the coordinate plane and examine the ratio of...
EngageNY
Polynomial, Rational, and Radical Relationships
This assessment pair goes way beyond simple graphing, factoring and solving polynomial equations, really forcing learners to investigate the math ideas behind the calculations. Short and to-the-point questions build on one another,...


