Curated OER
Study Guide for Missing May
Use this comprehensive packet to accompany a study of Missing May by Cynthia Rylant. Starting out with a brief author biography and background information about the novel, this guide includes materials to use throughout the entire novel....
Balanced Assessment
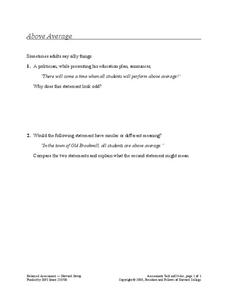
Above Average
Raise the bar and strive to be above average. The assessment task requires budding mathematicians to think critically and evaluate given statements. What does it truly mean to be above average?
Pingry School
Comparing Activities of Selected Metals
Don't overreact! A simple experiment demonstrates chemical reactions as scholars mix chemical solutions and metals in a large well plate. They note all changes to the metals, solutions, precipitate, colors, and more. A full data table...
Education Development Center
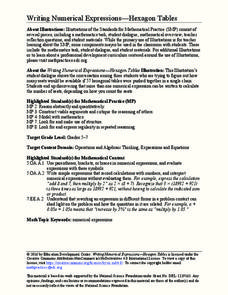
Writing Numerical Expressions—Hexagon Tables
Explore a basic pattern to practice writing expressions. In collaborative groups, learners examine a contextual pattern and write an expression to model it. The task encourages groups to describe the pattern in multiple ways.
Concord Consortium
Bicycle Chain
Model a bicycle chain with circles and tangent lines. Given the dimensions of the sprocket wheels, young scholars calculate the length of the chain that surrounds them. A second task has learners write a function for the length of a...
Chicago Botanic Garden
Unit 3 Pre-Test, Grades 7–9
Earth's systems respond to changes in environments in all types of ways including migration, extinction, adaptation, immigration, and emigration to name a few. Part one in a series of seven is a pre-test consisting of 14 questions. Some...
Pingry School
Solubility Product of an Ionic Compound
How do scientists determine when a solution is fully saturated? Scholars address the topic as they observe patterns of precipitation in various concentrations of ions. Using a well plate, pipette, and common chemicals, they collect data...
Education Development Center
Creating Data Sets from Statistical Measures
Explore the measures of central tendency through a challenging task. Given values for the mean, median, mode, and range, collaborative groups create a set of data that would produce those values. They then critique other answers and...
Education Development Center
Creating a Polynomial Function to Fit a Table
Discover relationships between linear and nonlinear functions. Initially, a set of data seems linear, but upon further exploration, pupils realize the data can model an infinite number of functions. Scholars use multiple representations...
Concord Consortium
Broken Spreadsheet I
There is power in spreadsheet formulas and learners use this power to model quadratic data. Given a scatterplot of a parabola, pupils create formulas in a spreadsheet to populate the data. The formulas they use lead to an understanding...
Sundance
Teaching Strategies: The Giver
Can utopia be achieved? Included here are three literature worksheets to pair with Lois Lowry's The Giver. Pupils work in groups to come up with solutions to society's issues, individuals back up a statement related to a topic in the...
Concord Consortium
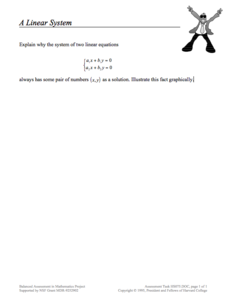
A Linear System
Young mathematicians have the hang of graphing with integer coefficients now. Can they generalize what they've learned to equations with variable coefficients? The task asks individuals to verify the solution to the system is (x,y) and...
EngageNY
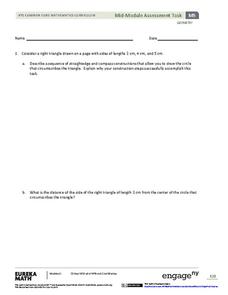
Geometry Module 5: Mid-Module Assessment
How can you formally assess understanding of circle concepts? Pupils take a mid-module assessment containing five questions, each with multiple parts.
EngageNY
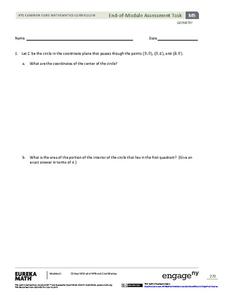
Geometry Module 5: End-of-Module Assessment
The lessons are complete. Learners take an end-of-module assessment in the last installment of a 23-part module. Questions contain multiple parts, each assessing different aspects of the module.
Balanced Assessment
Sloppy Student I
"Does this work every time?" We've all heard it. Now learners get to explore methods to answer that question themselves. Pupils analyze a mistake that has been made with creating a formula for multiplying binomials. They then create...
Concord Consortium
Betweenness III
Don't let a little challenge get between your pupils and their learning! Scholars compare two absolute value functions to recognize patterns and use them to build their own functions with outputs that are between the given. They then...
Fluence Learning
Writing Informative Text: School Days
A three-part writing assessment challenges scholars to think critically about schools of the past and present. Learners read informative texts, answer questions to prepare for a discussion, research in small groups, complete a Venn...
Fluence Learning
Writing About Literary Text: Wise or Foolish?
A three-part assessment promotes reading comprehension skills. Class members read literary texts and take notes to discuss their findings, answer comprehension questions, write summaries, and complete charts.
Curated OER
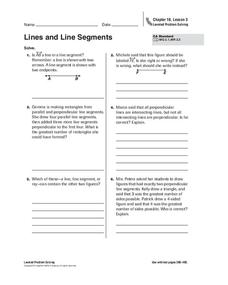
Lines and Line Segments
In this lines and line segments worksheet, students solve 6 word problems where they identify lines and line segments, draw rectangles made of line segments, and define perpendicular and intersecting lines. The problems require higher...
Fluence Learning
Divide Shapes
Let's partition rectangles into equal parts. Assess learners on their ability to divide shapes into equal parts, and their ability to explain their thinking.
Fluence Learning
Writing a Narrative: How Bear Lost His Tail
After reading the first, second, and third parts of "How Bear Lost His Tail", third grade writers answer questions about the story by completing a series of options, including discussion points. Then, they begin to plan a new narrative...
Marshall Cavendish International
Coordinate Plane Treasure Hunt
Similar to the game Battleship®, partners try and determine where the opponent buried their treasures on the hidden coordinate plane. Two types of planes are provided, one with only quadrant one and one with all four for a higher...
Virginia Department of Education
Graphs
Examine different types of graphs as a means for analyzing data. Math scholars identify the type of graph from a series of data displays and then develop questions to match each one. Then, given a scatter plot of height versus age...
Fluence Learning
Writing an Opinion: Buddies that Bark or Purr-fect Pets?
Which animal is best for you—a dog or cat? Why? Engage third graders in an opinion writing assessment that prompts them to read facts about both pets, and then write and decide which pet is best for them.

