Curated OER
How to Achieve Your Financial Goals
Students explore economics by creating a budget. In this financial goal setting instructional activity, students investigate their use of time by completing a worksheet. Students identify financial goals they would like to achieve in the...
Shodor Education Foundation
Marbles
Grab some marbles from a bag. The applet simulates drawing marbles from a bag. Pupils determine the number of four colors of marbles in a bag and how many marbles to draw. Using information on whether order matters in the draw and if...
Shodor Education Foundation
Function Flyer
Fly through graphing functions with the Function Flyer. Young mathematicians use an interactive to graph different types of functions. A set of exploration questions has users investigate patterns in functions.
Curated OER
Using "Kindness"
Students discover the benefits of kind acts by dissecting the word itself. In this vocabulary lesson, students utilize the letters in the word "kindness" to create other words which they record. Students figure out what...
Shodor Education Foundation
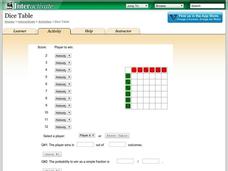
Dice Table
Convert a table to probabilities. Pupils set up the winning rules for the sums of two dice. Using the rules, the applet fills out a table showing the winners for each combination. Learners determine the probabilities of winning for each...
Shodor Education Foundation
Estimating With Fire
Watch the damage from a forest fire in this interactive simulation activity that challenges learners to estimate the burn area using different approaches. Learners are given a worksheet to track the different burn patterns and practice...
Shodor Education Foundation
Regression
How good is the fit? Using an interactive, classmates create a scatter plot of bivariate data and fit their own lines of best fit. The applet allows pupils to display the regression line along with the correlation coefficient. As a final...
Shodor Education Foundation
Scatter Plot
What is the relationship between two variables? Groups work together to gather data on arm spans and height. Using the interactive, learners plot the bivariate data, labeling the axes and the graph. The resource allows scholars to create...
Shodor Education Foundation
Life
How does life evolve? The interactive provides a simulation based on the Game of Life invented by mathematician John Conway. Users can run the applet with the preset rules and settings or adjust them to view whether overpopulation or...
Shodor Education Foundation
Derivate
Derive tangent lines through derivatives. Scholars use an app to graph functions and investigate derivatives and tangent lines. The interactive automatically graphs a tangent line at a specified point and can also produce tables of values.
Shodor Education Foundation
Recursion
Perform the operation ... and then do it again. Scholars investigate recursive formulas by creating and graphing them. Using the interactive, pupils set the variable, determine the initial value, and type in a recursive formula.The...
Shodor Education Foundation
Squaring the Triangle
Teach budding mathematicians how to square a triangle with an interactive that shows a graphical proof of the Pythagorean Theorem. Pupils alter the lengths of the legs using sliders. Using the inputted lengths, the applet displays the...
Shodor Education Foundation
InteGreat!
Take a great look at integration! Young scholars use an interactive to learn how to integrate a function. Learners input a function and view the integral as well as see a graphical representation.
Shodor Education Foundation
Rabbits and Wolves
A change in a parameter can end in overpopulation. The resources gives pupils the opportunity to control the parameters of rabbits and wolves in a natural setting. Using the set parameters, the simulation runs and displays the population...
Shodor Education Foundation
Pythagorean Theorem
Most adults remember learning about the Pythagorean theorem, but they don't all remember how to use it. The emphasis here is on developing an intuitive understanding of how and when to use the theorem. Young mathematicians explore...
Shodor Education Foundation
Triangle Area
While the lesson focuses on right triangles, this activity offers a great way to practice the area of all triangles through an interactive webpage. The activity begins with the class taking a square paper and cutting in in half; can they...
Curated OER
The Centroid of a Triangle
Students familiarize themselves with the construct and measure menus. They demonstrate how to use the Sketchpad Calculator. They draw a triangle and construct the centroid. They shade in each of the small triangles and measure the area.
Shodor Education Foundation
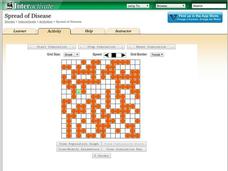
Spread of Disease
Control the spread of a contagious disease. An applet allows pupils to run a simulation on the spread of a disease. Rules govern how the disease is spread and the length of time it takes to recover. Learners view the spread visually and...
Shodor Education Foundation
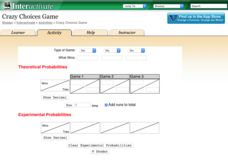
Crazy Choices Game
Wanna take a chance on which game is best? The resource provides three games of chance using multiple types of games. Games range from coin toss to cards. Choosing a type of game, pupils determine what wins and enter the theoretical...
Shodor Education Foundation
Spinner
Go round and round to compare theoretical and experimental probabilities. Learners set the number of sectors and the number of spins for a spinner. Then, a table displays the experimental and theoretical probabilities of the spinner for...
Shodor Education Foundation
Data Flyer
Fit functions to data by using an interactive app. Individuals plot a scatter plot and then fit lines of best fit and regression curves to the data. The use of an app gives learners the opportunity to try out different functions to see...
Shodor Education Foundation
Conic Flyer
Graphing conics made easy. Individuals use an interactive to graph conic sections. The app can handle circles, vertical and horizontal parabolas, ellipses, and vertical and horizontal hyperbolas.
Shodor Education Foundation
Cross Section Flyer
Scholars see cross sections come to life using an app to investigate cross sections of three-dimensional solids. They look at prisms, pyramids, cylinders, cones, and double cones.
Shodor Education Foundation
Overlapping Gaussians
Adjust the overlap to compare probabilities. Using sliders, learners adjust the shape of two Gaussian curves. The interactive calculates the area of the left tail for one curve and the right tail for the other. Pupils set the interactive...
