Curated OER
Coordinate Crunch
Students identify plots on a graph while playing a game on a large coordinate grid and then on smaller grids.
Curated OER
Graphing Greenery
Middle schoolers gather leaves and trace them on graph paper. They plot coordinates that approximate the shape of the leaves and share those coordinates as "worksheets" for other students to complete.
Curated OER
Discovering PI
In this pi activity, students identify and complete 4 different problems that include pi and graphing data points. First, they complete the chart at the top by measuring the diameter and circumference of each object. Then, students plot...
Curated OER
Plotting Coordinates on a Cartesian Plane
Students practice identifying points on a coordinate plane, creating charts, and calculating ratios. In groups, students play a "battleship" game where they determine the location of their own fleet and attempt to find the location of...
Curated OER
Graphs
In this graph worksheet, 6th graders have to identify the given points, and plot them on the empty graph. Students identify 8 points.
Curated OER
Geometry Coordinates
In this geometry coordinates worksheet, students plot given ordered pairs. This one-page worksheet contains 6 problems.
Curated OER
Graphing and the Coordinate Plane
Students examine the four quadrants of Cartesian coordinate plane. They play maze games and coordinate games to discover how to read and plot points on the plane. Students plot points on the coordinate plane and examine the ratio of...
Inside Mathematics
Archery
Put the better archer in a box. The performance task has pupils compare the performance of two archers using box-and-whisker plots. The resource includes sample responses that are useful in comparing individuals' work to others.
Curated OER
Plotting Rectangular Coordinates
Students practice plotting coordinates on a flat surface or plane. The coordinates can be identified and labeled. An interesting variation of this process is made in the lesson when the position of holes made by thrown darts are plotted.
Curated OER
Graphing on a Coordinate Plane
Eighth graders explore the coordinate system. They identify the x and y-axis, parts of the coordinate plane, and discuss the process of plotting points. To emphasize the process of plotting points, 8th graders play an ordered pair...
Curated OER
TAKS 3rd Grade Upkeep 3
In this TAKS worksheet, 4th graders identify patterns, determine the best operation, and plot numbers on a number line. The three questions pertain to objectives covered on the Texas state test. This would be good bellwork.
Curated OER
X & Y Coordinates
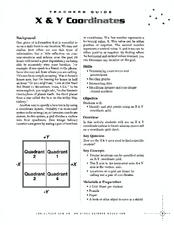
Students identify and plot points. In this graphing lesson, students use an X and Y coordinate grid to locate missing spacecraft on a coordinate grid sheet.
Inside Mathematics
Scatter Diagram
It is positive that how one performs on the first test relates to their performance on the second test. The three-question assessment has class members read and analyze a scatter plot of test scores. They must determine whether...
Curated OER
LRO and the Apollo-11 Landing Site
In this Apollo-11 landing site worksheet, students read about the NASA Lunar Reconnaissance Orbiter (LRO) that will collect images at a higher resolution than ever before. Students study a grid showing the lunar landing site from Apollo...
Curated OER
Linear and Exponential Functions
This comprehensive unit on linear and exponential functions provides numerous clearly-written worksheets. Topics include graphing linear equations, solving systems of equations algebraically and by graphing, identifying the domain and...
Statistics Education Web
Now You SeeIt, Now You Don't: Using SeeIt to Compare Stacked Dotplots to Boxplots
How does your data stack up? A hands-on activity asks pupils to collect a set of data by measuring their right-hand reach. Your classes then analyze their data using a free online software program and make conclusions as to the...
Inside Mathematics
Coffee
There are many ways to correlate coffee to life, but in this case a worksheet looks at the price of two different sizes of coffee. It requires interpreting a graph with two unknown variables, in this case the price, and solving for...
Curated OER
Cinderbank
Fourth graders identify major components of a "Cinderella" story in order to create a database.
Inside Mathematics
Graphs (2006)
When told to describe a line, do your pupils list its color, length, and which side is high or low? Use a worksheet that engages scholars to properly label line graphs. It then requests two applied reasoning answers.
Mathematics Vision Project
Module 6: Congruence, Construction, and Proof
Trace the links between a variety of math concepts in this far-reaching unit. Ideas that seem very different on the outset (like the distance formula and rigid transformations) come together in very natural and logical ways. This...
Curated OER
A Turkey for Thanksgiving - Lesson #2
Second graders investigate realistic fiction, holiday celebrations, making tally charts. In this multi-disciplinary lesson, 2nd graders listen to a story about Thanksgiving and one about the Chinese New Year to develop an understanding...
Curated OER
Functions and Their Graphs
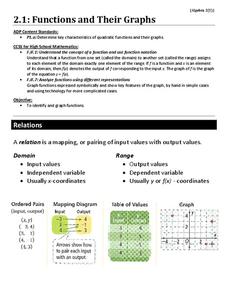
Use a instructional activity to go over the basic concepts of relations and functions. Included are clear definitions and examples of relations, domain and range, and functions and the vertical line test. However, the problems are...
Noyce Foundation
Snail Pace
Slow and steady wins the race? In the assessment task, scholars calculate the rates at which different snails travel in order to find the fastest snail. Hopefully, your class will move much more quickly in finishing the task!
Curated OER
The Perfect City
Young scholars analyze group influences on people, events and culture. They design their own perfect society and report it to the class.


