Radford University
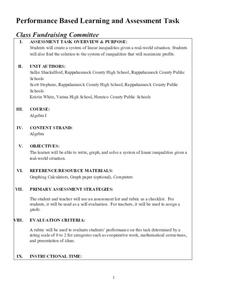
Class Fundraising Committee
Given the task of coming up with a fundraiser, small groups determine the type of fundraiser to hold and restraints on the number of participants. The classmates create inequalities to represent the constraints and graph the solution to...
National Nanotechnology Infrastructure Network
Lines on Paper - Laser Box
See what you cannot see by getting a little creative. An intriguing lesson has learners use lasers to explore X-ray diffraction. Given a box with unknown structures, they shine a laser through the box and interpret the results....
CCSS Math Activities
Smarter Balanced Sample Items: 7th Grade Math – Target D
Put expressions, equations, and inequalities to work! Young scholars solve problems using various strategies. Meant as a snapshot of the Smarter Balanced Assessment, a set of seven questions includes topics from writing expressions to...
University of Colorado
The Moons of Jupiter
Can you name the three planets with rings in our solar system? Everyone knows Saturn, many know Uranus, but most people are surprised to learn that Jupiter also has a ring. The third in a series of six teaches pupils what is around...
Concord Consortium
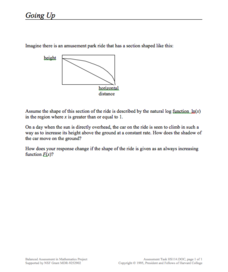
Going Up
Going on up—and up and up! An open-ended task asks learners to model the movement of an amusement ride with parametric equations. They then analyze their equations to determine how the shadow of the ride's car moves as it rises at a...
Curated OER
Activity: Gummy Bear Genetics
Who's your Daddy ... and Mommy for that matter? Given a first-generation group of gummy bear offspring, young scientists must determine which bears are their parents. An activity worksheet covers the differences in genotypes and...
UAF Geophysical Institute
Carbon Footprint
Your young environmentalists can calculate their carbon footprint and discuss ways to reduce it with a worksheet about climate change. After reading a handout about what impact one's carbon footprint can have on the environment, kids...
Odell Education
Scientific Process and Experimental Design
The scientific method keeps you from believing only what you want to believe — it expands your mind. The lesson introduces the eight steps in the scientific process and how to design an experiment to biology scholars. Live insects...
Math Drills
Multiplication Five Minute Frenzy (E)
How fast can you multiply one- and two-digit numbers? Have kids keep track of their success as they work on these math drills. Each grid features ten numbers on the x axis that kids can multiply by the ten numbers on the y axis.
Curated OER
The Kangaroo Conundrum: A Study of a Quadratic Function
Students play a game and collect data for their graph. In this algebra lesson, students solve quadratic equations and identify properties of their graph. They describe the pattern created by the graph and the game.
Curated OER
Analyzing Graphs
In this statistics and probability worksheet, students analyze frequency distribution tables or histograms and box and whisker plots. The two page worksheet contains four multiple choice questions. Answers are included.
Curated OER
One More/One Less Scoop
It's so simple: scoop a spoonful of counters, count them, and then make a set that is one more than that number. Next, make a set that is one less. The tangible nature of this basic addition and subtraction activity will keep learners...
PBS
Light Curves of Kepler's First Five Discoveries
The Kepler missions discovered and confirmed more than 2,650 exoplanets to date. A video shares the data from the first five discoveries. It provides graphs and diagrams to put each discovery in perspective to help scholars discuss the...
Centers for Disease Control and Prevention
Major Disparities in Adult Cigarette Smoking Exist Among and Within Racial and Ethnic Groups
Data indicates that some racial groups smoke more than others, and that with that racial group, there are smaller groups whose smoking habits vary as well. Secondary learners read a graph that details the differences between the Asian...
Curated OER
Linear Inequalities
In this algebra worksheet, students solve linear inequalities. They graph their solution on a coordinate plane. There are 6 questions with answer key.
Curated OER
Balanced Or Unbalanced
Students use physical models and graphs in order to solve problems that have their origin in the real world that require algebraic thinking. The words are changed into equations and inequalities in order to be solved. This requires...
Curated OER
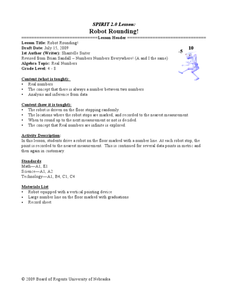
Robot Rounding!
Young scholars collect data on a robot and relate the behavior to prove there is an infinite minute set of numbers. In this algebra lesson, students verify that there is always a number between two numbers. They analyze and make...
Curated OER
Learning to Make Data Tables
Learners construct data tables using the results of previous experiments. In this graphing activity, students plot data and interpret the results. Learners discuss how they organized their data.
Curated OER
Frequency Tables and Histograms
In this graph worksheet, 5th graders study the data presented on a bar graph. Students then respond to 4 short answer questions using the information that has been provided.
Curated OER
Inequality Shading Investigation
In this inequality instructional activity, students graph the inequality of a line. They list ten integer coordinates that lie on the grid. Students explore their findings and answer thought questions. They shade the graph to indicate...
Curated OER
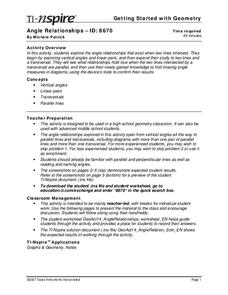
Angle Relationships
Tenth graders explore the angle relationships that exist when two lines intersect. In this geometry lesson, 10th graders estimate the measure of given angles and use their graphing calculator tools. Students use this knowledge to find...
Curated OER
Solving Systems of Equations by graphing for Algebra One
Learners watch the teacher demonstrate on an overhead projector how to graph various equations before the students try them on their own. They start with pencil and paper; once they grasp the concept they move on to punching in the...
Federal Reserve Bank
Barbie in the Labor Force
How have the women's share of the labor force and chosen occupations evolved in the United States over the last century? Using census reports, graphs detailing the gender makeup of the labor force, and analysis of the careers of...
Virginia Department of Education
Factoring for Zeros
Relate factors to zeros and x-intercepts. Scholars first graph quadratics in both standard and factored forms to see that they are the same. They go on to use the graphs to see the relationship between factors and x-intercepts.
