Curated OER
Using Random Sampling to Draw Inferences
Emerging statisticians develop the ability to make inferences from sample data while also working on proportional relationships in general. Here, young learners examine samples for bias, and then use random samples to make...
Curated OER
Bread in a Bag
Could the history of bread really be interesting? Yes, it could! An informational text gives scholars wheat production background from 8,000 years ago, discussing different types of bread and the current industry in Oklahoma. Learners...
American Statistical Association
More Confidence in Salaries in Petroleum Engineering
Making inferences isn't an exact science. Using data about salaries, learners investigate the accuracy of their inferences. Their analyses includes simulations and randomization tests as well as population means.
EduGAINs
Data Management
Using a carousel activity, class members gain an understanding of the idea of inferences by using pictures then connecting them to mathematics. Groups discuss their individual problems prior to sharing them with the entire class....
Curated OER
Arc GIS Project: Visualizing the Holocaust
A cross-curricular lesson for middle schoolers that covers language arts, social studies, geography, and math, this is a great extension activity if your class is reading The Diary of Anne Frank or learning about the Holocaust....
Education World
The African American Population in US History
How has the African American population changed over the years? Learners use charts, statistical data, and maps to see how populations in African American communities have changed since the 1860s. Activity modifications are included to...
August House
Anansi Goes to Lunch - Kindergarten
Greed is the theme of the West African folktale, Anansi Goes to Lunch and this multidisciplinary collection of lessons. First, scholars listen to a read aloud and participate in a grand conversation about the book's key details and...
Statistics Education Web
Population Parameter with M-and-M's
Manufacturers' claims may or may not be accurate, so proceed with caution. Here pupils use statistics to investigate the M&M's company's claim about the percentage of each color of candy in their packaging. Through the activity,...
Curated OER
Memories to Last: Observing Monuments
Students use scientific observation and inference to examine the Hazen Brigade Monument. In this observation lesson, students review the reasons for building monuments in society. Students then recall monuments they have seen and...
Curated OER
Statistics Canada
Students practice using graphing tools to make tables, bar charts, scatter graphs, and histograms, using census data. They apply the concept of measures of central tendency, examine the effects of outliers. They also write inferences and...
Curated OER
the Sound Detective Scientist
Students identify sounds in their environment and acquire listening and inferring skills.
Curated OER
Inferring Height From Bone Length
Students determine the relationship between bone length and height. In groups, they are told the race and gender of the individual and discuss how this affects height. They measure the lengths of the bones in metric measurements and...
Virginia Department of Education
Exploring Statistics
Collect and analyze data to find out something interesting about classmates. Groups devise a statistical question and collect data from their group members. Individuals then create a display of their data and calculate descriptive...
Illustrative Mathematics
Election Poll, Variation 1
Your class will learn what it means to take a random sample of a population and to draw inferences from the information gained. In part a, of the exercise, you discuss with your class how students during a class election can be best...
Curated OER
Algebra 1
Students study the functional relationships of a variety of problems. In this functional relationship activity, students determine the dependent and independent quantities of a given set of data. Students record the data and...
American Statistical Association
Confidence in Salaries in Petroleum Engineering
Just how confident can we be with statistics calculated from a sample? Learners take this into account as they look at data from a sample of petroleum engineer salaries. They analyze the effect sample size has on a margin of error and...
Federal Reserve Bank
Arts and Economics Infographic Questionnaire
How do careers in the arts contribute to America's gross domestic product? Use an informative infographic that details the economic details of careers in the core arts, including design services, performing arts, and arts education, to...
Curated OER
Application and Modeling of Standard Deviation
The first activity in this resource has learners computing the mean and standard deviation of two different data sets and drawing conclusions based on their results. The second activity has them using a dice-rolling simulation to...
Curated OER
What Can Scatterplots Tell Us?
Eighth graders use data from surveys conducted with parents, peers and themselves to create computer-generated scatterplots. They make inferences from their scatterplots.
Curated OER
Do You Have a Sinking Feeling
Students determine how marine archaeologists use historical and archaeological data to draw inferences about shipwrecks. Students plot the position of a shipwrecked vessel, and draw inferences about the shipwreck from artifacts that have...
Curated OER
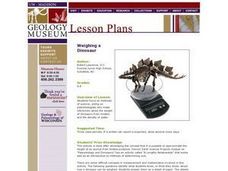
Weighing a Dinosaur
Young scholars role play as paleontologists who make inferences about the weight of dinosaurs. They use models and the density of water to make these inferences.
Curated OER
Venn Diagram and UK Basketball
Students analyze data and make inferences. In this algebra lesson plan, students collect and analyze data as they apply it to the real world.
Curated OER
Gathering Data to Problem Solve
Students, while using reading and writing strategies (subheads, prediction, skim, details, drawing inferences, etc,), solve math problems that involve gathering and representing data (addition, subtraction, multiplication). They practice...
Curated OER
History's Thermometers
High schoolers explain the concept of paleoclimatological proxies. In this oxygen isotope lesson, students interpret data and make inferences about climate changes in the geologic past.
Other popular searches
- Making Inferences Worksheet
- Teaching Inference
- Inference Lesson Plans
- Observation and Inferences
- Making Inferences in Reading
- Reading Making Inferences
- Making Inference
- Inference Skills
- Observation Inference
- Making Inferences Grade 2
- Inference and Conclusions
- Making Inferences Stories


