Mathed Up!
Tallys and Charts
After watching a brief instructional video, young mathematicians are put to the test. By completing and reading frequency tables, tally charts, and bar graphs, individuals show their understanding of how to interpret data.
Mathed Up!
Two Way Tables
When presented with categorical data, a two-way frequency table is a great way to summarize the information. Pupils organize categorical data using a two-way table, then use the tables to determine missing data and to calculate simple...
Mathed Up!
Frequency Polygons
Frequency polygons are a different way to represent frequencies over intervals. Pupils take frequencies for intervals of data from a frequency table and plot them as a frequency polygon. Budding mathematicians find information about the...
Mathed Up!
Money Problems
Mo' money, mo' problems! But don't worry, here is an assessment that proves to young mathematicians that they can solve actual money problems. The resource includes 11 money problems involving addition, subtraction, multiplication, and...
Mathed Up!
Fractions of an Amount
After viewing a video on fractional amounts, young mathematicians put their new knowledge to the test. Throughout the assessment, class members find the fractional amount for prices, times, and populations. There are a few percent and...
Mathed Up!
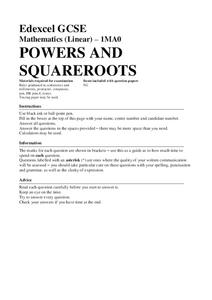
Powers and Square Roots
Square root and exponential powers are the focus of the assessment worksheets included in a math resource. Young mathematicians answer 10 questions, each with subset questions, involving solving a variety of exponential equations and...
Mathed Up!
Shading Fractions of Rectangles
Learners find the midpoint between two numbers, shade fractional amounts of rectangles as well as decimal amounts of rectangles, and explain their mathematical reasoning in words. The assessment is a great way to check for understanding...
Mathed Up!
Congruent Shapes
Are congruent shapes compatible? Congruent shapes are identical to one another, and throughout the assessment, young mathematicians identify given shapes as congruent.
Mathed Up!
Angles
What does a geometric farmer drive? A protractor, of course! A set of assessment worksheets prompts learners to use a protractor as they measure angles, name angles, and identify lines. Use the video as a way to introduce the concepts.
Mathed Up!
Multiplication and Division
Multiplication and division of decimals by whole numbers is the focus of these assessment worksheets. Learners solve equations by showing their work in order to arrive at the correct answer.
Mathed Up!
Stem and Leaf Diagrams
Order the data within a stem-and-leaf display. Pupils take data and create and ordered stem-and-leaf diagrams, including the key. Participants take their data and determine answers about the information. Class members then find measures...
Curated OER
A Weigh we Go!
Here are some cross-curricular activities whil should help your kids understnad weight measurements and grammar. In this grammar and math lesson, young scholars read the book Skittles Riddles and practice counting and balancing skittles....
Curated OER
The Game is Afoot - A Study of Sherlock Holmes
Mystery is an exciting genre for young readers to investigate. The plots are so intriguing! Here is a series of lessons featuring Sherlock Holmes stories that invite learners to enter the world of the mystery genre. Based on what they...
Mathed Up!
Negative Numbers
Individuals read tables with temperatures and times in order to distinguish the town with the lowest temperature or most extreme temperature difference. Each of the eight questions has three sub-questions that use the same charts.
Mathed Up!
Angles: Parallel Lines
Viewers are presented with seven problems with parallel lines and angle relationships and must use the given information to find the measures of specific angles. To finish, they explain their process in finding the measures in the problems.
Kenan Fellows
Solutions
Scientists require specific chemical solutions for their experiments. In the seventh and final installment in a series that integrates chemistry and algebra II, scholars learn to set up a system of equations to solve the volume of a...
Curated OER
Mean in Statistics: Practice Finding Averages
Using an online, interactive practice exercise, learners calculate the mean of six sets of numbers. A handy tool to provide practice or assess mastery. Immediate feedback notes correct responses and leaves incorrect ones in place so...
Illustrative Mathematics
Grass Seedlings
Plants never grow at the same rate, and that is the antithesis for this word problem involving multiplication of fractions. On the instructional activity, Raul notices that Pablo's seedlings are 1 1/2 times as tall, and Celina's...
Curated OER
Graphing Fun In Third Grade
Third graders display information in a graph, table, and chart. In this data lesson plan, 3rd graders look at graphs, tables, and charts, discuss their importance, and make their own.
Curated OER
Test 3 Math Review
In this fractions instructional activity, students complete a 22 question assessment. Students read each word problem and solve. Included are all beginning and advanced fraction concepts.
Curated OER
Reading a Graph: Azimuth Range vs. Day in Barrow Alaska
Students practice reading a graph while doing story problems. They determine the x and y intercepts and calculate the slope. They also practice writing linear equations.
Curated OER
Hickory Dickory Doc Tell Time
Learners discover time keeping by reading clocks. In this time-telling lesson, students read the story Hickory Dickory Dock, and discuss the measurements of time we use. Learners complete worksheets in which they identify the times of...
Illustrative Mathematics
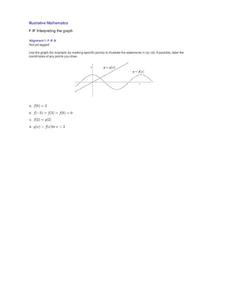
Interpreting the graph
The purpose of this exercise is to give practice in reading information about a function from its graph. Learners are given graphs of two functions on the same axes. The task is to locate and label various key points on the graph that...
Illustrative Mathematics
Warming and Cooling
Is it too hot to go hiking? This task asks learners to refer to a graph that shows temperature as a function of time and answer five questions about the scenario depicted by the graph. The exercise could be used for instruction to help...


