Curated OER
Statistics for Graphing
Learners use the Internet to access a variety of websites that present statistics and information for use in graphing. They represent sports statistics, geographical measurements, temperatures and more.
Curated OER
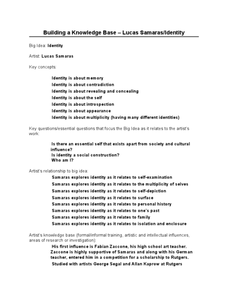
Building a Knowledge Base - Lucas Samaras/Identity
Bring art into your classroom with this resource for teaching the concept of identity through Lucas Samaras' identity boxes. Use this list of information to help plan out a unit on identity as demonstrated through art. While not...
Curated OER
Kindergarten Class Favorites
Students discuss their favorite foods, a list of four favorite food are compiled on the board or a chart. They each vote for their favorite food and the data is entered onto a spread sheet and a graph is created while the students watch...
Curated OER
Here's an Instant Activity for December 20, 2004
Help learners improve their spelling skills by completing a word analysis activity. They complete the instant activity by finding the hidden words inside each given word. There is a menu of skill ideas and various ways suggested to...
Curated OER
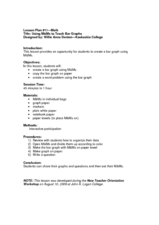
Using M&M's to Teach Bar Graphs
Motivate your class with this lesson. While not fully fleshed out, this activity is meant to be used as an introduction to the use of bar graphs. Learners sort M&M's and create bar graphs to display their information.
Curated OER
Weather Instrument Data Information
In this science worksheet, students are given the task of recording weather information twice daily using the homemade weather instruments.
Curated OER
Analysis of Newspaper Articles
Students investigate journalism by researching a list of articles. In this story analysis lesson plan, students read several current event articles and answer a list of study questions as a group. Students summarize the article and share...
Teach Engineering
Searching for Bigfoot and Others Like Him
Individuals create a GIS data layer in Google Earth that displays information about where one might find seven different cryptids. The class members research to find data on cryptid sightings they can include in their data layer.
Inside Mathematics
Snakes
Get a line on the snakes. The assessment task requires the class to determine the species of unknown snakes based upon collected data. Individuals analyze two scatter plots and determine the most likely species for five additional data...
Discovery Education
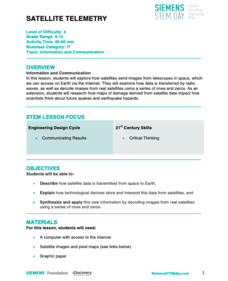
Satellite Telemetry
Satellites require rockets to launch, but it doesn't take a rocket scientist to understand them. Future engineers learn about how satellites send data to Earth and how to interpret satellite images. They see how radio waves play a role...
Teach Engineering
The Challenge Question
A research position becomes a modeling job. The introductory lesson in a series of nine presents the challenge of analyzing a set of bivariate data. The class brainstorms what the data may represent. Pupils must decide what is needed to...
BrainPOP
World History Lesson Plan: Uncovering Essential Questions
Have you ever noticed a news story revolves around an essential question? Scholars research methods of reporting historical events. Working in groups, they use an interactive module to gather information on a historical topic, uncovering...
Curated OER
Performance-Based Assessment Practice Test (Grade 4 ELA/Literacy)
Track the progress of your fourth graders' reading and writing skills with this practice Common Core assessment. Based on a collection of six reading passages that include narrative stories, poetry, and a series of informational...
Laboratory for Atmospheric and Space Physics
The Planets and Scale
Scholars gain an insight into the relative size of planets and distance between inner and outer planets with the help of informational text, a data table, and a series of four questions.
University of Minnesota
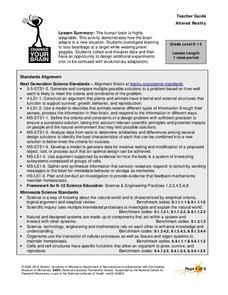
Altered Reality
Fascinate young life scientists by showing them how their brain learns. By using prism goggles while attempting to toss bean bags at a target, lab partners change their outlook on the world around them, producing amusing results....
EngageNY
The Mean Absolute Deviation (MAD)
Is there a way to measure variability? The ninth resource in a series of 22 introduces mean absolute deviation, a measure of variability. Pupils learn how to determine the measure based upon its name, then they use the mean absolute...
American Statistical Association
Chunk it!
Chunking information helps you remember that information longer. A hands-on activity tests this theory by having learners collect and analyze their own data. Following their conclusions, they conduct randomization simulations to test...
College Board
Evaluating Sources: How Credible Are They?
How can learners evaluate research sources for authority, accuracy, and credibility? By completing readings, discussions, and graphic organizers, scholars learn how to properly evaluate sources to find credible information. Additionally,...
US Department of Commerce
Looking at Numbers of Births Using a Line Graph
Was there a baby boom? Using census data, class members take a look at the number of 8-11 year olds and determine their birth years. Scholars create a double line graph to compare the number of births for two states for several years....
American Statistical Association
Scatter It! (Using Census Results to Help Predict Melissa’s Height)
Pupils use the provided census data to guess the future height of a child. They organize and plot the data, solve for the line of best fit, and determine the likely height and range for a specific age.
National Security Agency
Starting a Restaurant
Through an engaging unit, chefs-in-training will sort and classify data using tally charts. Learners will also create bar graphs to display restaurant data and interpret data from bar graphs using a variety of categories. This is a fun...
CCSS Math Activities
Smarter Balanced Sample Items: High School Math – Claim 4
What is the appropriate model? Sample problems show the extent of the Smarter Balanced assessments Claim 4, Modeling and Data Analysis. Items provide pupils the opportunity to use mathematical modeling to arrive at a reasonable answer....
Curated OER
Button Bonanza
Collections of data represented in stem and leaf plots are organized by young statisticians as they embark some math engaging activities.
Bowland
Mystery Tours – Plan Your Tour
Everyone loves a vacation and a set of three activities has groups planning a tour of the U.K. using given distance, time, and price data. They solve a variety of problems related to the trip and produce a report on the success of the trip.


