EngageNY
Graphs of Simple Nonlinear Functions
Time to move on to nonlinear functions. Scholars create input/output tables and use these to graph simple nonlinear functions. They calculate rates of change to distinguish between linear and nonlinear functions.
Illustrative Mathematics
Function Rules
Function machines are a great way to introduce the topic of functions to your class. Here, you will explore the input and output to functions both using numerical and non-numerical data. Learners are encouraged to play with different...
Texas Instruments
Function Notation - Texas Instruments
Using a TI-Nspire calculator, learners will work to better understand function notation and input/output functions. They write equations with a function symbols, identify what makes an equation a function, and graph lines in order to...
Curated OER
Interactivate: Introduction to Functions
This interactive website provides a variety of lesson plans according to which standards you are applying and which textbook you use. Introduce functions to your class by having them construct single operation machines and create...
EngageNY
Representing, Naming, and Evaluating Functions (Part 1)
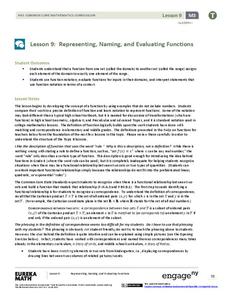
Begin the discussion of domain and range using something familiar. Before introducing numbers, the lesson uses words to explore the idea of input and outputs and addresses the concept of a function along with domain and range.
EngageNY
Representing, Naming, and Evaluating Functions (Part 2)
Notation in mathematics can be intimidating. Use this lesson to expose pupils to the various ways of representing a function and the accompanying notation. The material also addresses the importance of including a domain if necessary....
EngageNY
Formal Definition of a Function
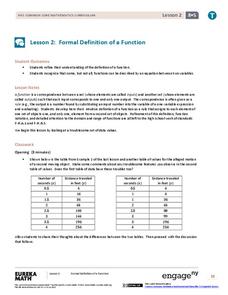
Formalize the notion of a function. Scholars continue their exploration of functions in the second lesson of the module. They consider functions as input-output machines and develop function rules for selected functions.
EngageNY
Graphs of Functions and Equations
Explore the graphs of functions and equations with a resource that teaches scholars how to graph functions as a set of input-output points. They learn how the graph of a function is the graph of its associated equation.
Curated OER
A Sum of Functions
Collaborative learners will see the geometric addition of functions by graphing the sum of two graphed curves on the same coordinate plane. This task then naturally flows into giving learners the algebraic representation of the curves...
EngageNY
Graphs of Linear Functions and Rate of Change
Discover an important property of linear functions. Learners use the slope formula to calculate the rates of change of linear functions. They find that linear functions have constant rates of change and use this property to determine if...
Willow Tree
Linear Relationships
There's just something special about lines in algebra. Introduce your classes to linear equations by analyzing the linear relationship. Young mathematicians use input/output pairs to determine the slope and the slope-intercept formula to...
West Contra Costa Unified School District
Evaluating Functions
Functions as inputs for other functions? After reviewing function notation and how to input values to evaluate functions, class members input functions into functions, essentially determining the composition of functions.
Curated OER
Monster Frog Function Machine
Elementary schoolers use a function machine in order to help them look at the relationship between input and output, and to look at the rule for the change. The machine is actually a cardboard box, and it serves quite well for the...
Curated OER
Function Graphing--ID: 8252
Those graphing calculators can be tricky; good thing Texas Instruments has devised a lesson on how to use their TI-Nspire calculator to graph functions. Kids investigate functional notation as they graph ordered pairs in the form (a,...
Virginia Department of Education
Composition of Functions
Analyze functions by decomposing complex functions and composing simple functions. Through a detailed lesson plan, pupils learn the vocabulary and notation related to the composition of functions. Practice includes both evaluating and...
Alabama Learning Exchange
Building Functions: Composition of Functions
Hammer away at building different types of functions. An engaging lesson builds on learners' knowledge of domain and range to create an understanding of composite functions. Young scholars learn to write composite functions...
EngageNY
Comparing Linear Functions and Graphs
How can you compare linear functions? The seventh installment of a 12-part module teaches learners how to compare linear functions whose representations are given in different ways. They use real-world functions and interpret features in...
Curated OER
What's My Function?
Students use input / output tables to help them solve algebraic equations. They use patterns and relations to represent and analyze mathematical situations using algebraic symbols.
02 x 02 Worksheets
Inverse Functions
Young mathematicians look for patterns in inverse functions as they relate to the original functions. The comprehensive instructional activity emphasizes vocabulary throughout as well as algebraic and graphical characteristics of the...
EngageNY
Linear Functions and Proportionality
Connect linear equations, proportionality, and constant rates of change to linear functions. Young mathematicians learn how linear equations of the form y = mx + b can represent linear functions. They then explore examples of linear...
West Contra Costa Unified School District
Introduction to Inverse Functions
Ready to share the beauty of the inverse function with your classes? This algebra II lesson guides the discovery of an inverse function through a numerical, graphical, and an algebraic approach. Connections are made between the three,...
Alabama Learning Exchange
Building Functions: Reverse to Inverse
Reverse the wrapping to get to the gift. Using the idea of unwrapping a gift, the lesson introduces the concept of inverses. Pupils first determine the order needed to evaluate a function at a point, then use the reverse to find the...
West Contra Costa Unified School District
Evaluating Functions Graphically and Algebraically
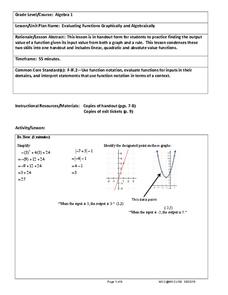
High schoolers evaluate functions graphically and algebraically. After completing that step, they write a statement describing the input and output.
EngageNY
The Height and Co-Height Functions of a Ferris Wheel
Show learners the power of mathematics as they model real-life designs. Pupils graph a periodic function by comparing the degree of rotation to the height of a ferris wheel.


