Food a Fact of Life
Brilliant Baking
Young chefs are introduced to the use of the oven with an activity that asks them or whip up a batch of fruity flapjacks or tropical granola bars. Yum!
Polar Trec
Drawing Diatoms like Ernst Haeckel
Why do scientists rely on drawings rather than just photographs of their research studies? The lesson introduces drawings of microscopic organisms and the importance of accuracy. Young artists draw organisms and learn why focus and...
Curated OER
Reptiles and Amphibians
Introduce your class to various reptiles and amphibians. They will meet and identify a representative from each of the four major reptile families, then learn about and discuss reptile characteristics. Next, they will identify and...
Curated OER
Endocrine System - Hormones
Use this attractive PowerPoint to introduce all the hormones and their functions to your students. As students view each slide, they should be able to see the relevance of many of the chemicals and their interaction with the human body....
Curated OER
Modernism: American Literature 1914-1945
What characterizes modern literature? The first few slides of this 31-slide PowerPoint discuss what sparked the change to Modernism and discuss some of the key figures of the time (like Karl Marx and Sigmund Freud). The 20s and 30s are...
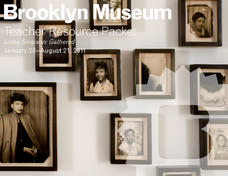
Brooklyn Museum
Lorna Simpson: Gathered
Lorna Simpson is a photographer who has put together a collection of photos from the 1950s in order to challenge the idea that primary source documents are objective in their portrayal of history. Learners are introduced to Ms. Simpson's...
Student Handouts
What's My GPA?
Here is an excellent, detailed one-page reference sheet to introduce students to what a grade point average (GPA) is and how to calculate their own.
Royal Geographical Society
An Introduction to Maps
First graders are introduced to a variety of maps such as globes, street maps, atlases, and different types of floor plans. The focus of the lesson plan requires individuals to create their own plan of the classroom using the...
EngageNY
Graphs of Piecewise Linear Functions
Everybody loves video day! Grab your class's attention with this well-designed and engaging resource about graphing. The video introduces a scenario that will be graphed with a piecewise function, then makes a connection to domain...
Code.org
Functions and Top-Down Design
Let me break it down for you! Introduce your class to a way of breaking up a complicated task into its component pieces. Individuals draw a complex figure using JavaScript and then break it down to help determine the...
EngageNY
Federal Income Tax
Introduce your class to the federal tax system through an algebraic lens. This resource asks pupils to examine the variable structure of the tax system based on income. Young accountants use equations, expressions, and inequalities to...
EngageNY
Law of Cosines
Build upon the Pythagorean Theorem with the Law of Cosines. The 10th part of a 16-part series introduces the Law of Cosines. Class members use the the geometric representation of the Pythagorean Theorem to develop a proof of the Law of...
EngageNY
Informal Proof of AA Criterion for Similarity
What does it take to show two triangles are similar? The 11th segment in a series of 16 introduces the AA Criterion for Similarity. A discussion provides an informal proof of the theorem. Exercises and problems require scholars to apply...
Math Mammoth
Measuring Angles
The first of two pages displays various angles as the measure of degrees of a circular arc. An explanation is written, and learners are asked to model each by holding up two pencils as the rays. The second page provides instruction on...
Lewiston High School
Weight and Mass & Forces in Equilibrium
I would weigh less on the moon? Send me there, then! On the top of the first page, a cartoon image demonstrates the difference between Earth and the moon. It then goes on to describe weight and mass and provides five practice problems...
Curated OER
Wonderful Whales
Primary marine biologists consider the largest living animals on Earth, the whales. Introduce them to general anatomy, unique adaptations, and behaviors. Teach them to sing a song that will help them remember some of these facts....
Curated OER
Pictographs
What do these pictographs show? Scholars analyze three sets of data organized into pictographs, filling in several comprehension questions about each. The first one is done for them as an example, but consider going over it together to...
Bowels Physics
Electric Circuits
Investigate the construction of the electric circuit with a thorough presentation that provides a solid background for each type of circuit. After introducing key vocabulary, the lesson goes on to explain circuit design.
Cornell University
Glued into Science—Classifying Polymers
Explore the unique characteristics of polymers. A complete lesson begins with a presentation introducing polymers. Following the presentation, young scientists develop a laboratory plan for creating substances using polymers. They...
Howard Hughes Medical Institute
Human Impacts on Biodiversity
Have you always wanted to take your science class on an amazing field trip they will never forget? Now you can! Observe the wildlife in an African savanna through trail cameras with a five-part data analysis activity. Learners analyze...
Curated OER
Building a Ship Lesson Plan
Pupils draw a ship to scale, and calculate the real life size. They show that measurements on the drawingsare annotated with the distances reported in inches (fractions and decimals), and their real-world equivalents
Curated OER
Math - Design a Ship
Students design a ship. They calculate square footage and draw their ship to scale. They build models of their ships.
Curated OER
Measurement and the Illampi Mound Colony
Pupils comprehend the basic units of measurement, scale, plotting, and basic grids. Students practice their estimation
and measuring skills and will demonstrate their ability to work well in groups.
Curated OER
Graphs
Students graph ordered pairs to model the relationship between numbers. After observing the patterns in ordered pairs, they describe the relationship, and create graphs from a data table. Students describe intervals in the graph, and...


