Curated OER
Measurement
Students investigate non-standard linear measurement. In this cross curriculum measurement lesson plan, students listen to the book Measuring Penny by Loreen Leedy, and identify pages in which non-standard measurement is used. Students...
Curated OER
Price of Apples- Linear Data
Students collect data and create a graph. In this algebra instructional activity, students describe functions graphically, algebraically and verbally. They identify functions as being independent and dependent using variables.
Curated OER
How Do They Relate? Linear Relationship
Young scholars collect information and use a line to represent it. In this algebra lesson, students investigate real world data to see if it makes a line. They graph the line comparing the relationship of the x axis with that of the y axis.
Virginia Department of Education
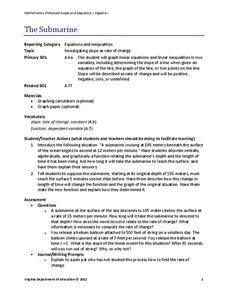
The Submarine
Submerge yourself in the study of slope. Scholars investigate a situation involving slope and the rate of change of a submarine. An additional example further explores the concept of slope by changing one of the conditions of the submarine.
Curated OER
Exploring Linear Equations
Eighth graders follow the teacher as they enter information into the graphing calculator. They investigate different graphs to explain the slope of a line, the y intercept, and parallel lines.
Curated OER
Magic Squares, Simultaneous Equations, Hill Walking, and Diophantine Equations
In this solving equations worksheet, 9th graders solve and complete 21 various types of problems. First, they use the method shown to find the value of xin each equation. Then, students use an algebraic approach to solve the magic...
Curated OER
Scatterplots and Regressions
In this scatterplots and regressions activity, students solve 6 different types of problems related to graphing scatterplots and interpreting regressions. First, they create a scatterplot from the given data coordinates and then,...
101 Questions
Styrofoam Cups
How many cups does it take to reach the top? Learners attempt to answer this through a series of questions. They collect dimension information and apply it to creating a function. The lesson encourages various solution methods and...
National Research Center for Career and Technical Education
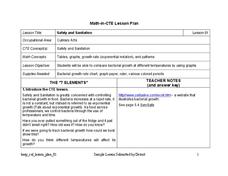
Safety and Sanitation
Your microbiologists explore the graphing of exponential growth functions using bacteria, like e. coli and salmonella, in a well-written, career and technology lesson.
Curated OER
Expressing Geometric Properties with Equations
Algebra and geometry are not interchangeable. Demonstrate why not with a series of problems that deal with the equations of circles and equations of lines that meet specific criteria.
CK-12 Foundation
Direct Variation: Value of a Painting
Help your pupils find a pattern of direct variation. Young scholars use input-output pairs to find a constant of variation and then write the equation. As they build their equations, the interactive lesson provides feedback.
101 Questions
The Biggest Loser
Sometimes losing is actually winning! Learners use a proportional analysis to compare percent weight loss of contestants on The Biggest Loser. The resource provides data and clips from the show to facilitate the lesson.
101 Questions
Two Lane Road
Two vehicles move at a constant rate of speed toward each other, but when exactly will they pass? Pupils use still images from a video to determine the rate of speed and when the two cars meet. Then, they watch the complete video to...
Concord Consortium
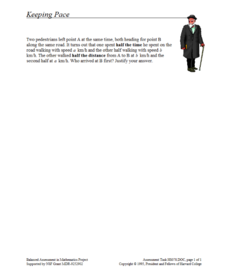
Keeping Pace
What came first, pedestrian one or pedestrian two? Scholars consider a problem scenario in which two people walk at different rates at different times. They must decide who reaches a checkpoint first. Their answers are likely to surprise...
Curated OER
Baseball Relationships - Using Scatter Plots
Students use graphing calculators to create scatter plots of given baseball data. They also determine percentages and ratios, slope, y-intercepts, etc. all using baseball data and statistics.
Illustrative Mathematics
Global Positioning System II
Intricate details of a modern technology that many of us take for granted in our phones, computers (and some cars) are laid bare in a short but deeply investigative activity. The math behind a seemingly simple GPS device is...
EngageNY
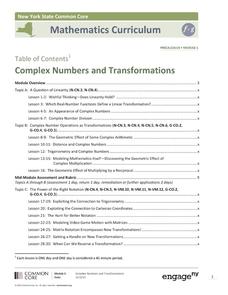
Complex Numbers and Transformations
Your learners combine their knowledge of real and imaginary numbers and matrices in an activity containing thirty lessons, two assessments (mid-module and end module), and their corresponding rubrics. Centered on complex numbers and...
Inside Mathematics
House Prices
Mortgages, payments, and wages correlate with each other. The short assessment presents scatter plots for young mathematicians to interpret. Class members interpret the scatter plots of price versus payment and wage versus payment for...
Ohio Department of Education
I Can Do This! Systems of Equations
Use tables, graphs, and substitution to solve systems of linear equations. An envelope of sample problems is passed around the classroom, and each learner has the opportunity to solve the system in the envelope. This is a great way to...
EngageNY
Increasing and Decreasing Functions 1
Model situations with graphs. In the fourth installment of a 16-part module, scholars learn to qualitatively analyze graphs of piecewise linear functions in context. They learn to sketch graphs for different situations.
Curated OER
Dental Impressions
What an impressive task it is to make dental impressions! Pupils learn how dentists use proportional reasoning, unit conversions, and systems of equations to estimate the materials needed to make stone models of dental impressions....
EngageNY
Geometric Sequences and Exponential Growth and Decay
Connect geometric sequences to exponential functions. The 26th installment of a 35-part module has scholars model situations using geometric sequences. Writing recursive and explicit formulas allow scholars to solve problems in context.
Inside Mathematics
Party
Thirty at the party won't cost any more than twenty-five. The assessment task provides a scenario for the cost of a party where the initial fee covers a given number of guests. The class determines the cost for specific numbers of guests...
Curated OER
Graphing Inequalities in Two Variables
This study guide is a great resource to help you present the steps to graphing linear inequalities. Show your class two different ways to graph an inequality and work on a real-world example together. The document could also be easily...
Other popular searches
- Linear Model Ling
- Linear Models and Fractions
- Non Linear Models
- Modeling Linear Data
- Fractions Linear Model
- More Linear Models
- Predicting Linear Models


