Rice University
Intermediate Algebra
Algebra concepts are all wrapped up in one nice bow. The resource combines all the concepts typically found in Algebra I and Algebra II courses in one eBook. The topics covered begin with solving linear equations and move to linear...
EngageNY
Vectors and the Equation of a Line
Represent linear equations in both two and three dimensions using parametric equations. Learners write parametric equations for linear equations in both two and three variables. They graph and convert the parametric equations to...
PBL Pathways
Doctors and Nurses
How many nurses does it take to support one doctor? A project-based activity asks learners to analyze state data to answer this question. Classes create polynomial functions from the data of doctors and nurses over a seven-year...
CCSS Math Activities
Smarter Balanced Sample Items: 8th Grade Math – Target F
Functions model relationships between quantities. The Smarter Balanced sample items demonstrate the assessment strategies for eighth grade function modeling standards. Items range from constructing linear functions from a table and a...
Achieve
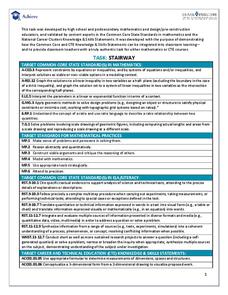
Stairway
It's the stairway to learning! Scholars research all aspects of building a staircase. Using information from building codes, they write and graph a system of inequalities to analyze the constraints. The completed project is a scale model...
PBL Pathways
Students and Teachers 2
Examine trends in student-to-teacher ratios over time. Building from the first task in the two-part series, classes now explore the pattern of student-to-teacher ratios using a non-linear function. After trying to connect the pattern to...
Howard County Schools
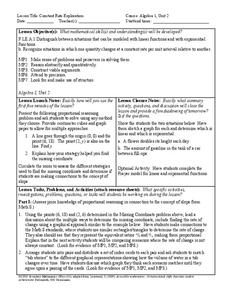
Constant Rate Exploration
Question: What do rectangles and bathtub volume have in common? Answer: Linear equations. Learn how to identify situations that have constant rates by examining two different situations, one proportional and one not proportional.
Curated OER
Y-Intercept and Slope Intercept Form
Alegebra amateurs identify the slope and the y-intercept given a linear equation in slope-intercept form by correctly completing some in class problems. They write the linear equation in slope-intercept form that corresponds to the given...
EngageNY
Finding Systems of Inequalities That Describe Triangular and Rectangular Regions
How do you build a polygon from an inequality? An engaging lesson plan challenges pupils to do just that. Building from the previous lesson plan in this series, learners write systems of inequalities to model rectangles, triangles,...
Inside Mathematics
Graphs (2004)
Show your pupils that perimeter is linear and area is quadratic in nature with a short assessment task that requests learners to connect the graph and equation to a description about perimeter or area. Scholars then provide a...
Howard County Schools
Generous Aunt
Witness the power of exponential growth with an activity that investigates two different savings plans. Class members create tables of values to see how and when a savings plan increasing exponentially exceeds one increasing linearly.
Mathematics Assessment Project
Representing Functions of Everyday Situations
Functions help make the world make more sense. Individuals model real-world situations with functions. They match a variety of contexts to different function types to finish a helpful resource.
PBL Pathways
Medical Insurance 3
Create a technical report explaining the components of a medical plan through a function. The project-based learning activity gives a medical insurance scenario that young mathematicians model using piecewise functions. Their analyses...
CCSS Math Activities
Smarter Balanced Sample Items: 8th Grade Math – Claim 4
A math model is a good model. A slide show presents 10 sample items on modeling and data analysis. Items from Smarter Balanced illustrate different ways that Claim 4 may be assessed on the 8th grade math assessment. The presentation is...
Education Development Center
Creating a Polynomial Function to Fit a Table
Discover relationships between linear and nonlinear functions. Initially, a set of data seems linear, but upon further exploration, pupils realize the data can model an infinite number of functions. Scholars use multiple representations...
Howard County Schools
Maria’s Quinceañera
How long will it take to save up for a car? Classmates use linear and exponential models to see how money received during a Quinceanera will grow over time.
EngageNY
Interpreting Correlation
Is 0.56 stronger than -0.78? Interpret the correlation coefficient as the strength and direction of a linear relationship between two variables. An algebra lesson introduces the correlation coefficient by estimating and then...
EngageNY
Word Problems
Use several skills to solve word problems leading to systems of equations. Scholars define variables and write equations to model situations described within word problems. Pupils solve the resulting system of linear equations using...
Georgetown University
Cup-Activity: Writing Equations From Data
Determine how cup stacking relates to linear equations. Pupils stack cups and record the heights. Using the data collected, learners develop a linear equation that models the height. The scholars then interpret the slope and the...
Howard County Schools
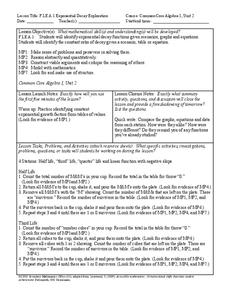
Exponential Decay Exploration
How can you model exponential decay? Explore different situations involving exponential decay functions and decreasing linear functions by performing activities with MandM candy, popcorn kernels, and number cubes.
Virginia Department of Education
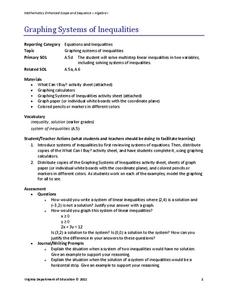
Graphing Systems of Inequalities
Apply systems of inequalities to a real-world problem. Here, scholars learn to graph solutions to systems of linear inequalities. To finish the lesson, they solve a problem involving burgers and cheeseburgers using a system of inequalities.
EngageNY
Mid-Module Assessment Task - Algebra 1 (Module 3)
Having trouble finding performance task questions? Here is an assessment that uses all high-level thinking questions. It includes questions to assess sequences, linear functions, exponential functions, and increasing/decreasing intervals.
Howard County Schools
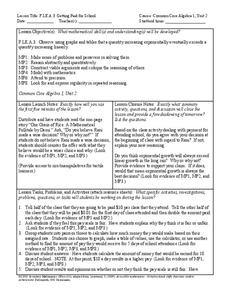
Getting Paid for School
What if you were paid to attend class? What kind of payment schedule would you choose? Learn how exponential functions will eventually exceed linear functions by comparing two different payment schedules for attending class.
Curated OER
Walk-A-Thon
Students graph linear http://www.lessonplanet.com/review?id=180542equations. In this problem solving lesson, students calculate slope and plot ordered pairs on a coordinate grid. Using a real-life example of a walk-a-thon, students...


