EngageNY
More on Modeling Relationships with a Line
How do you create a residual plot? Work as a class and in small groups through the activity in order to learn how to build a residual plot. The activity builds upon previous learning on calculating residuals and serves as a precursor to...
Virginia Department of Education
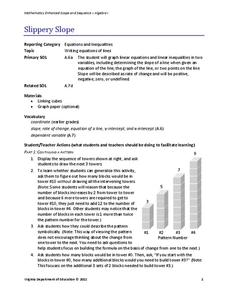
Slippery Slope
Explore slope using geometric patterns. Young mathematicians investigate towers built from cubes to develop a linear pattern. They move the data to a coordinate plane to connect the pattern to slopes.
Curated OER
Introduction to Functions
Students explore functions, function rules, and data tables. They explore terms of linear functions. Students use computers to analyze the functions. Students write short sentences to explain data tables and simple algebraic expressions.
Curated OER
Patterns and Functions
Students investigate properties of perimeter and area. In this middle school mathematics lesson, students explore patterns in a problem solving context. Students model and solve problems using various representations for the data as...
Curated OER
VARIABLES AND PATTERNS, USE AFTER INVESTIGATION THREE. DISCRETE OR CONTINUOUS LINEAR RELATIONS.
Students discover for which kind of linear function is appropriate to use the "scatter" or the "connected" term. In this lesson, students investigate functions using variables, patterns book, graph paper, rulers and the graphit program.
Curated OER
Making Money and Spreading the Flu!
Paper folding, flu spreading in a school, bacteria growth, and continuously compounded interest all provide excellent models to study exponential functions. This is a comprehensive resource that looks at many different aspects of these...
Curated OER
Model and Solve Algebraic Equations
Examine multiple ways to solve algebraic equations. Pupils will generate a problem solving strategy that addresses the prompt given by the teacher. They will then share their problem solving strategy with the class. Graphic organizers,...
Curated OER
Graphs and Functions
Use this series of activities to introduce learners to graphing functions. They graph both linear and quadratic equations by hand and with a Graph Sketcher Tool. Several imbedded links and handouts are included in the lesson.
Curated OER
Math: Methods of Measurement
Fourth graders practice linear measurement skills by applying various measuring instruments to determine the heights of classmates. By measuring the heights of second graders and fourth graders, they construct tables of height and age...
EngageNY
Informally Fitting a Line
Discover how trend lines can be useful in understanding relationships between variables with a lesson that covers how to informally fit a trend line to model a relationship given in a scatter plot. Scholars use the trend line to make...
Curated OER
Writing Equations in Slope-Intercept Form
Use this worksheet to write equations in both point-slope form and slope-intercept form. Start by writing equations given one point and the slope and finish by writing equations given two points and a few real-world applications. The...
Curated OER
Confusing Colors!
Fourth graders collect data, graph their data, and then make predictions based upon their findings. They's interest is maintained by the interesting way the data is collected. The data collection experiment is from the psychology work of...
Curated OER
Mathematics Within: Algebraic Patterns
Students discover patterns in linear equations by playing a dice game to collect data. They graph the data and analyze the patterns of the lines created by the data. The class then compares the individual graphs to evaluate the position...
Curated OER
The Window Problem
Students identify patterns and compute formulas to solve the problems. In this algebra lesson, students come up with a rule given a pattern, and analyze the relationship between data and graphs.
Curated OER
Move It
Studens collect and graph data. In this algebra lesson, young scholars use a CBL and CBR with a TI Calcualtor to observe linear graphs. They use the correct vocabualry as they discuss the collected data.
Curated OER
How popular is your favorite site?
Students gather data for the project for the entire year. They plot their data, try to fit a equation to their data, and speculate on why the data shows the pattern it does and project its future growth.
Curated OER
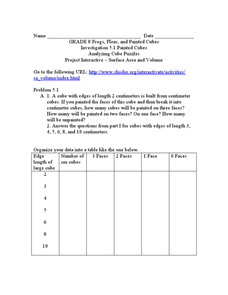
Analyzing Cubes
In this analyzing cubes worksheet, 9th graders solve and complete 6 different types of problems. First, they organize the given data into the table provided. Then, students study the patterns in the table and tell whether the pattern of...
Curated OER
Interpreting Graphs
Sixth graders interpret linear and nonlinear graphs. They create graphs based on a problem set. Next, they represent quantitive relationships on a graph and write a story related to graphing.
Curated OER
Discovering Growth Patterns
Students explain the differences between linear (arithmetic) and exponential (geometric) growth. They use worksheets imbedded in this instructional activity to help them make predicitions and graph data points.
Curated OER
Graphing Real World Situations
Students solve linear equations using graphs. In this algebra instructional activity, students depict real life situation using lines and functions. They identify the slope, data and predict graphing behavior.
Curated OER
Swimmy's Friends
Students solve problems using various strategies. In this problem solving lesson, students read the book Swimmy by Leo Lionni. Students make fish swimming patterns, measure how many goldfish crackers it takes to make a handprint and...
Curated OER
Linear Sequences and Terms
Young scholars identify the nth rule for each sequence. In this algebra lesson, students finish the pattern or sequence and find the missing term. They relate patterns and sequences to the real world.
American Statistical Association
How Tall and How Many?
Is there a relationship between height and the number of siblings? Classmates collect data on their heights and numbers of brothers and sisters. They apply statistical methods to determine if such a relationship exists.
Curated OER
How Does Your Population Grown?
Do you know how the population has grown of your community? Can you predict the population over the next half century? Can we find an algebraic model that matches our data? These along with many more questions can be researched by...


