Math Mammoth
Bar Graphs 1
In this bar graph activity, students organize data in a frequency table, then create a bar graph. They find the average of the data. This one-page activity contains two multi-step problems.
Curated OER
Histograms
In this histograms instructional activity, students solve 5 word problems based on a histogram of presidential ages at their inauguration. Next, students create a frequency table and a histogram based on a list of data which shows the...
Noyce Foundation
Ducklings
The class gets their mean and median all in a row with an assessment task that uses a population of ducklings to work with data displays and measures of central tendency. Pupils create a frequency chart and calculate the mean and median....
Curated OER
Dealing with Data
Seventh graders collect and analyze data. In the seventh grade data analysis lesson, 7th graders explore and/or create frequency tables, multiple bar graphs, circle graphs, pictographs, histograms, line plots, stem and leaf plots, and...
Curated OER
Data Analysis: For Little Learners
Using pictographs, tally charts, and surveys, kids learn all about data analysis and collection. They make surveys, collect data, then construct pictographs and tally charts to organize their information.
Math Moves U
Collecting and Working with Data
Add to your collection of math resources with this extensive series of data analysis worksheets. Whether your teaching how to use frequency tables and tally charts to collect and organize data, or introducing young mathematicians to pie...
American Statistical Association
A Sweet Task
Candy is always an effective motivator! A fun math activity uses M&M's and Skittles to explore two-way frequency tables and conditional probability. The candy can serve a dual purpose as manipulatives and experimental data.
Mathematics Vision Project
Modeling Data
Is there a better way to display data to analyze it? Pupils represent data in a variety of ways using number lines, coordinate graphs, and tables. They determine that certain displays work with different types of data and use two-way...
Concord Consortium
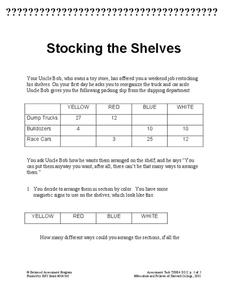
Stocking the Shelves
How many ways can you stock a shelf? It's probably more than you think! Young scholars use data in a frequency table to determine how many ways to stock a shelf given a specific constraint for types of groups. They then repeat the task...
Curated OER
What's the Frequency, Roy G. Biv?
Introduce starting space scientists to the electromagnetic spectrum, expecially the portion of visible light. Teach them about wavelength and frequesncy. Then give them a roll of adding machine tape and a manila folder to make a...
West Contra Costa Unified School District
Introduction to Conditional Probability
Here is a turnkey lesson that walks young statisticians through the development and uses of conditional probability. From dice games to surveys, Venn diagrams to frequency tables, the class learns how a given can effect the overall...
Beyond Benign
Water Bottle Unit
How much plastic do manufacturers use to create water bottles each year? The class explores the number of water bottles used throughout the years to determine how many consumers will use in the future. Class members compare different...
Curated OER
Integrated Algebra Practice: Frequency Histograms, Bar Graphs and Tables
In this graphs learning exercise, students solve 4 problems about histograms, bar graphs, and tables. Students answer questions about histograms, bar graphs, and tables.
Mathematics Vision Project
Module 9: Modeling Data
How many different ways can you model data? Scholars learn several in the final module in a series of nine. Learners model data with dot plots, box plots, histograms, and scatter plots. They also analyze the data based on the data...
Houghton Mifflin Harcourt
Unit 3 Math Vocabulary Cards (Grade 5)
Fifty-four flashcards make up a set to help reinforce math vocabulary. The set offers two types of cards; a word card printed in bold font, and a definition card equipped with an example and labels. Terms include capacity, histogram,...
Rice University
Introductory Statistics
Statistically speaking, the content covers several grades. Featuring all of the statistics typically covered in a college-level Statistics course, the expansive content spans from sixth grade on up to high school. Material comes from a...
Curated OER
Going Graph-y
Second graders listen to and dicuss the story Where the Wild Things Are. They play a pantomime game and act out various feelings so their classmates can guess. They listen for the frequency of certain words, and record their findings on...
Curated OER
Recording Frequency
First graders analyze nursery rhymes and gather data about word frequency. In this frequency lesson, 1st graders create graphs and tables. Students interpret the data.
Curated OER
Data Handling: Tally Chart on Illnesses
In this tally chart worksheet, students analyze a chart showing childhood illness cases. Students use the tally chart to solve 6 problems.
Curated OER
Tally Chart: Favorite Names
In this data display learning exercise, students analyze a tally chart of favorite hamster names. Using the information on the chart, students solve 8 word problems.
Curated OER
Histograms and Frequency Tables
In this statistics worksheet, students solve and analyze graphs. They use histograms and frequency tables to solve their problems. There are 2 multiple choice questions with an answer key.
Inside Mathematics
Winning Spinners
Winning a spin game is random chance, right? Pupils create a table to determine the sample space of spinning two spinners. Individuals determine the probability of winning a game and then modify the spinners to increase the probability...
Bowland
German or English?
Sprechen sie Deutsch? Future cryptographers must decide whether an unknown text is written in English or in German. They use provided pie charts about the frequency of words in the English and German languages to help make their decisions.
Curated OER
Frequency Histograms, Bar Graphs and Tables #3
In this frequency histograms activity, students examine bar graphs, histograms and tables. They identify the model of information that best matches the statistics. This three-page activity cotnains two multiple-choice problems. ...


