Illustrative Mathematics
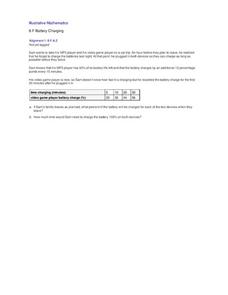
Battery Charging
Your class will be very interested in the results of this activity. How long does it take a MP3 and video game player to charge? Sam only has an hour and the MP3 player only has 40% of its battery life left. Plus, his video player...
Math Wire
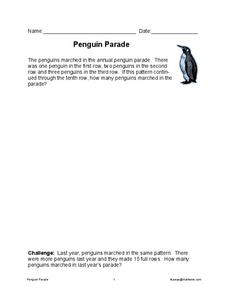
Penguin Parade
Make way for the penguin parade! Based on a given pattern of penguins in an ascending number of rows, how many penguins were marching this year? Learners solve two word problems to find the answer.
Bowland
German or English?
Sprechen sie Deutsch? Future cryptographers must decide whether an unknown text is written in English or in German. They use provided pie charts about the frequency of words in the English and German languages to help make their decisions.
EngageNY
Finding One Hundred Percent Given Another Percent
Class members solve problems to find the whole when given a percent. They use double line numbers and factors of hundred to help break the 100 percent into equal segments.
West Contra Costa Unified School District
Graph Square Root and Cube Root Functions
Scholars first learn to graph square root and cube root functions by creating a table of values. They then learn how to graph functions from transformation of the graphs of the parent square root and cube root functions.
Illustrative Mathematics
Are These Right?
Is that a right triangle or a wrong triangle? Young mathematicians look at eleven different shapes and use a measuring tool of their choice to determine which triangles have right angles. Consider cutting out sets of the shapes to...
Mathed Up!
Scatter Graphs
Make an estimate by getting in line. The class works with scatter plots and lines of best fit to make an estimate for given values. Pupils determine whether there is a positive or negative correlation and draw a best-fit line. Using the...
Math Mammoth
Decimal Problems
In this math worksheet, students are given tables and story problems with decimal points. Students must use the tables and story problems to find 10 answers about the data.
Curated OER
Cricket Weather
In this collecting data worksheet, 4th graders use the data collected on crickets chirps and the temperature to make a line graph by following 4 directives.
Curated OER
Linear Relations
In this linear relations worksheet, students complete a table for given functions. They classify graphs as linear or non-linear. Students graph given equations. They compare and contrast graphs. This nine page worksheet contains five...
Curated OER
Function Tables
In this function rules activity, students complete each function table or rule. Students complete the input and output sections for each table using the given numbers. Students complete two test prep questions.
Curated OER
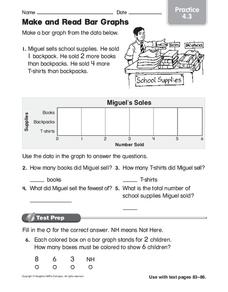
Make and Read Bar Graphs
In this bar graphs worksheet, learners make a bar graph about the sale of school supplies with the data presented in one story problem.
Curated OER
Find a Pattern problem solving 6.6
In this finding a pattern using a table activity, students write what they know and need to find out, make a table to show a pattern, and solve the pattern sequence. Students write nine answers.
Curated OER
Math Regents Exam Questions - Pearson Integrated Algebra P.304: Histograms
In this histograms learning exercise, students solve 9 short answer, multiple choice, and graphing problems. Students construct frequency tables and histograms of data.
Curated OER
Two Way Tables
In this online two way tables worksheet, students complete nine comprehensive two way tables with thirty questions and check their answers on line as they go.
Curated OER
New York State Math Test Grade 4
In this New York State math test worksheet, 4th graders complete multiple choice questions on money, multiplication, estimation, and more. Students complete 30 problems.
Curated OER
Third Grade NYS Math Regents
In this New York State Math Regents worksheet, learners complete six short answer problems based on the third grade math curriculum. Students must show all work.
Curated OER
Math Learning Center: High Flyin' Math Facts
In this High Flyin' math facts worksheet, students participate in an activity that combines various math problems that match up with each answer on the bows of the kites.
Curated OER
Visualize 3-D Objects and Make Nets of Common Solids
Prisms are the focus of this geometry worksheet. Students count the number of parts of a prism and chart 26 answers. Vocabulary such as: "faces," "edges," and "verticies" are taught. A well-designed math worksheet!
Curated OER
Number Search Y4: Make 12
In this number search worksheet, students find and highlight at least 12 addition, subtraction, multiplication and/or division math problems that make the sum of 12.
Curated OER
Reading Frequency Tables
In this data interpretation learning exercise, students record the data from 10 examples into frequency tables. They group 10 more data sets, and make a frequency table for each.
Curated OER
Dance Decisions
For this making decisions worksheet, 5th graders look over two charts/tables involving dance decisions and answer six mathematical questions relating to the charts/tables.
EngageNY
Multi-Step Problems in the Real World
Connect graphs, equations, and tables for real-world problems. Young mathematicians analyze relationships to identify independent and dependent variables. These identifications help create tables and graphs for each situation.
EngageNY
Comparison Shopping—Unit Price and Related Measurement Conversions
Speed up your scholars' understanding of ratios. Class members compare ratios related with speeds presented in different representations. They then use the unit rates to make the comparisons.


