Bonneville
Making Observations and Recording Data for Solar Powered Water Pumping
Get pumped about an activity with water pumps. The fifth of seven installments in the Understanding Science and Engineering unit has pupils learn how to make observations, record data, and create data displays. Each group measures the...
Curated OER
Close Observation: Coins
Integrate math, science, and speaking/listening with a collaborative hands-on activity. Each group works with a single penny, examining it with the naked eye and recording observations. Repeat using magnifying glasses. Then repeat with a...
Curated OER
Applied Science - Science and Math Lab 4B
Learners experiment with the combination of vinegar and baking soda. In this applied science lesson plan, future scientists compare qualitative and quantitative data collected from their exploration. Then they work together to analyze...
Captain Planet Foundation
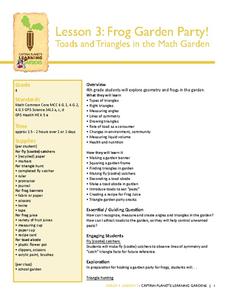
Frog Garden Party! Toads and Triangles in the Math Garden
It's frog party time! With frog banners, frog juice, and a triangle hunt, your garden party is sure to be both entertaining and educational. The lesson connects geometry, earth science, and delicious snacks to teach kids about ecosystems...
Curated OER
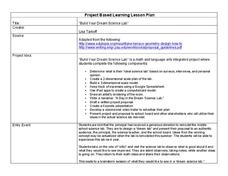
Build Your Dream Science Lab
Would your ideal science lab be filled with bubbling beakers and zapping Tesla coils? Or would it contain state-of-the-art computer technology and data analysis? Dream big with an innovative lesson that connects math and language...
Howard Hughes Medical Institute
Scientific Inquiry Using WildCam Gorongosa
How do scientists determine what questions to ask to meet their research goals? Help your class develop an inquiry mindset with a lesson based on studies in the Gorongosa National Park. Partners create their own research questions by...
Ahisma Summer Institute
The Power of One - Math in a Different Angle
In this 2-day lesson focused on exponents, middle schoolers will cross the curriculum by engaging in science, history and language arts activities. Exponential growth will be explored using grains of rice on a chess board. Exponential...
Curated OER
Scale Activities
How do you put something as large as the universe in perspective? Use a series of scale experiments. Classmates collaborate around four experiments to examine the scale of the earth-moon system, our solar system, the Milky Way galaxy,...
Curated OER
Make a Windmill
Students explore Earth science by conducting an energy experiment in class. In this windmill lesson, students identify how wind has been used to pump water throughout history and the latest developments wind energy has produced. Students...
Omaha Zoo
I Like to Move It
What do lemurs do best? They move! Lemurs like to jump, run, hop, and climb and it's your class's job to document seven fun lemur behaviors. The class starts by discussing why lemurs are considered primates, and then they isolate seven...
Big Kid Science
Measuring Shadows Using an Ancient Method
How did ancient peoples determine the height of really tall objects? Young scientists and mathematicians explore the concept of using shadows to measure height in a hands-on experiment. Paired pupils measure shadows, then calculate the...
Illustrative Mathematics
Temperatures in degrees Fahrenheit and Celsius
Learners investigate the relationship between the Fahrenheit and Celsius temperature scales. Given two data points, they construct a linear function to describe the relationship, find the inverse of the function, and make observations...
Berkshire Museum
Adopt a Schoolyard Tree
Help young scientists connect with nature and learn about trees with a fun life science lesson plan. Heading out into the school yard, children choose a tree to adopt, taking measurements, writing descriptions, and drawing sketches of it...
Howard Hughes Medical Institute
Gorongosa: Scientific Inquiry and Data Analysis
How does the scientific process begin? Introduce ecology scholars to scientific inquiry through an insightful, data-driven lesson. Partners examine data from an ongoing research study to determine the questions it answers. The resource...
Curated OER
Applied Science - Science and Math Lab
Learners examine fabric. In this Applied Science lesson, students look at the fibers of fabric through a microscope. Learners compare and contrast a variety of fibers.
Alcohol Education Trust
Talk About Alcohol: How Much Alcohol is in a Drink?
Introduce your class to alcohol content. In order to become aware of the varying strengths of alcoholic drinks, class members complete a chart and plot a bar chart with the results. They make observations about the results.
Achieve
BMI Calculations
Obesity is a worldwide concern. Using survey results, learners compare local BMI statistics to celebrity BMI statistics. Scholars create box plots of the data, make observations about the shape and spread of the data, and examine the...
Discovery Education
Fuss About Dust
Dust is everywhere around us; it's unavoidable. But what exactly is dust and are certain locations dustier than others? These are the questions students try to answer in an interesting scientific investigation. Working independently or...
Howard Hughes Medical Institute
Lesson 8: WildCam Gorongosa Data Analysis
How do scientists analyze data to get a specific answer to a question? The final chapter in an eight-part series of activities centered around Gorongosa National Park encourages scholars to dig deeper into the scientific process. After...
Baylor College
Needs of Plants
What better way to learn about plant life than by creating a class garden? Young botanists start with a brief discussion about radishes before planting seeds and watching them grow. To determine the importance of water,...
Howard Hughes Medical Institute
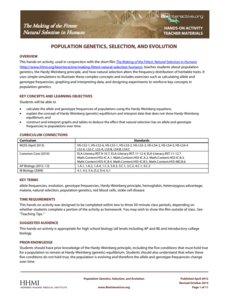
Population Genetics, Selection, and Evolution
The Hardy-Weinberg principle states that alleles and genotypes remain constant in the absence of evolutionary influences. Scholars complete a simple hands-on activity applying the Hardy-Weinberg principle to sample data. They observe how...
Curated OER
Let's Make a Compost Cake
Students create a compost cake. In this gardening and decomposition science instructional activity, students review and describe the "nutrient cycle." Students create a compost pile, measure and record the dimensions and temperature of...
Curated OER
What's in a Graph?
How many yellow Skittles® come in a fun-size package? Use candy color data to construct a bar graph and a pie chart. Pupils analyze bar graphs of real-life data on the Texas and Massachusetts populations. As an assessment at the end...
Curated OER
Weather Watchers
Students identify basic weather instruments and how they are used to record weather data. Students define several vocabulary terms as stated in lesson. Students use basic instruments to record weather data in their area. Students use the...


