Curated OER
Map It Out
Explore how illustrations add to a story. Young learners will look at picture books to see how the pictures tell the story. They create illustrations to go with a chosen story, and then flip the activity so they have to write a story to...
Curated OER
Action Through Art
How can we make the world a better place? Help your class members become world citizens, active in philanthropy and the community around them. Use a comic book (included) to discuss the idea of philanthropy. Then, using the superhero...
Curated OER
Journey Across the USA with Oliver K. Woodman
Challenge your class with this instructional activity focusing on the fifty states. Learners use ArcMap to show the route the main character in the story Journey of Oliver K. Woodman took across the United States. Then, they...
University of Richmond
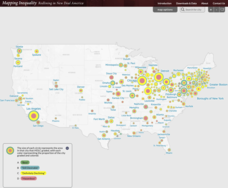
Mapping Inequality: Redlining in New Deal America 1935-1940
Redlining—or the practice of racial discrimination in housing loans—directly led to today's segregated living patterns in America. Using data from the federal Home Owners' Loan Corporation, classmates visualize the impact of policy on...
University of Florida
Six Bits of Abiotics
Collect clues and unwrap a mystery in an intriguing study about air pollution and urban forests. Teams share information to explore abiotic interactions and forest health. Scholars create a concept map using newly acquired knowledge and...
Curated OER
Using MY NASA DATA to Determine Volcanic Activity
Students explore how aerosols are used in science to indicate volcanic activity and how biomass burning affects global aerosol activity. Students access data and import into MS Excel using graphical data to make inferences and draw...
Curated OER
Using KidPix
Students discover how to use a software program known as KidPix. They create a slideshow noting the differences between rocks and minerals. They share their slides with the class.
Curated OER
Using Waves on the Job!
A colorful and comprehensive PowerPoint highlights this lesson on waves. Junior geophysicists pretend that they are hired to analyze seismic waves. A worksheet is provided to go along with an online article about how compact discs work...
Curated OER
Using Graphs
Print and use this useful unit on basic algebraic functions, domain, range, and graphing. Tasks include, illustrating simple functions with a graph, and identifying the domain and range of the function. This twelve-page packet contains...
Annenberg Foundation
America's History in the Making: Using Digital Technologies
How can digital technology of today link us to the events of the past? Scholars use technology to uncover the vast number of historical resources available in lesson 12 of a 22-part America's History in the Making series. Using databases...
CK-12 Foundation
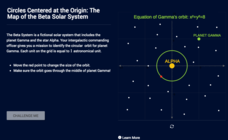
Circles Centered at the Origin: The Map of the Beta Solar System
Calculate galactic orbits in a far-out resource. Pupils drag a point on a circle to graph the orbit of a fictional planet. Using the equation, they find points through which the orbit passes. To finish the simulation, users determine the...
Mathematics Assessment Project
Funsize Cans
Designing fun-size cans ... what fun! Class members use the provided questions to determine the dimensions of a can with a minimum surface area for a given volume. The task allows learners to use graphs or algebraic manipulation to...
Office of the New Jersey State Climatologist
Play Ball! – Or Not…Making a Decision Using Weather Data
Should the game go on or not? An engaging lesson plan asks small groups to make a decision using weather data. After analyzing a map, an updated forecast, and radar information, groups have to decide whether to cancel a baseball game....
Curated OER
Pirate Treasure Hunt
First graders name the directions North, South, East, and West on a map. They work collaboratively in small groups and create a treasure map using directions as clues.
Curated OER
Homeostasis and Transport Concept Map
In this biology worksheet, students complete a concept map on cellular transport. They fill in 11 blanks with the correct terminology from the given list.
Curated OER
Sponges, Cnidarians and Worms Concept Map
In this sponges, cnidarians and worms worksheet, students complete a concept map on simple invertebrates. They fill in 11 blanks with the correct answers from the list.
Curriculum Corner
Digraph Word Map
Can you map a consonant digraph? You can when you have the right tools. Early readers can use this word map to create a visual that displays words with digraphs like sh, wh, ch, and th. They add the digraphs into the spaces provided and...
Curated OER
Mapping Landforms of South Carolina
Third graders analyze South Carolina maps. In this geography lesson, 3rd graders locate the five land regions in the state are and discuss how the regions are different. Students identify the major bodies of water and analyze how...
Curated OER
What a Relief Map
Students create a map using cookie dough. In this geography lesson, students research the physical features of a country, draw a diagram and design and create a map out of cookie dough.
Curated OER
Map Coloring
In this math worksheet, students create a map using different colors. They use a specific pattern and can use only four colors. This worksheet is a proof of the making of a map using no more than 4 colors. There is an answer key.
Curated OER
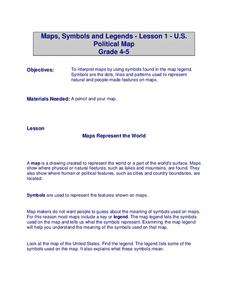
U.S. Political Map
Students explore the symbols found in a map legend. In this map skills lesson plan, students locate the legend on a political map and explain what each of the symbols mean. Students locate and identify several symbols on the map.
Curated OER
Map Reading in the 21st Century
Students interact with MapPoint tools to view maps of the past and the present in multiple ways. They participate in mini-lessons aimed at locating certain points of interest or famous routes taken in history.
Curated OER
Kinds of Maps
In this map worksheet, students match a set of descriptions with the names of different types of maps and answer true/false questions and short answer questions about using maps.
Curated OER
Mapping Districts
Students become literate in their use of maps. For this 2010 Census lesson plan, students visualize census data on maps, use map keys to read population maps, and explore the concept of population density.
