Curated OER
Do the Elephants Need Sunscreen? A Study of the Weather Patterns in Etosha
Students analyze the weather patterns in Namibia. They create a graph of the yearly temperatures and use the internet to gather information. They discuss how the weather goes in cycles in the area.
Curated OER
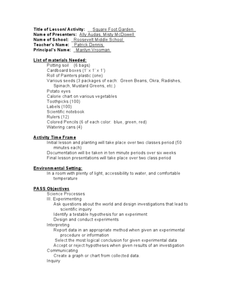
Square Foot Garden
Students plant a garden and keep track of it. For this geometrical garden lesson, students collect data from their garden twice a week. They graph their finding and figure out how many square feet of growing space each person needs...
Curated OER
Graphing With Candy
Students gather information and interpret the results using a tally chart, a table, and a bar graph.
Curated OER
Graphing Using Excel
Fifth graders complete a series of graphs by gathering information and using Excel to graph the information. For this graphing lesson, 5th graders graph favorite desserts of the class. Student put their results into the...
Curated OER
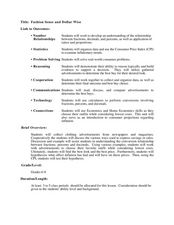
Fashion Sense and Dollar Wise
Students work in groups to show understanding of the relationship between fractions, decimals, percentages, and the application of ratios and proportions. In this decimals, fractions, and percents lesson, students use real life consumer...
Curated OER
Is the Hudson River Too Salty to Drink?
Students explore reasons for varied salinity in bodies of water. In this geographical inquiry lesson, students use a variety of visual and written information including maps, data tables, and graphs, to form a hypothesis as to why the...
Curated OER
What Does Time Have to Do with it?
Students investigate time. In this investigative activity, students run through an obstacle course using standard timers. They record the time and apply this knowledge to problems in math. Students record their predictions, and graph...
Curated OER
What's the Matter with My Snow?
Middle schoolers collect snow samples around their school. They explore the concepts of density and phase change as well as the math skills of measurement and statistics. Students explore the water cycle through an interactive, down...
Curated OER
Candy Land
In this activity students pretend that they have been hired by a candy manufacturer to design a box for a new product they are beginning to market. The manufacturer has pre-determined the volume of the candy box. It is the students' job...
Curated OER
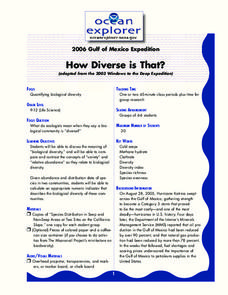
How Diverse is That?
Learners discuss biological diversity in ocean communities. In this diversity lesson, students examine the variety of organisms compared to relative abundance. They will write an analysis and discuss their findings with the class.
Curated OER
Osprey Journey
Students investigate the migration route of one bird, Osprey B4, using information gathered from satellites to track birds over a two-year period. They coimpare their graphs with maps of B4's migrations that have been plotted by...
Curated OER
Which Pizza
Seventh graders investigate the data related to finding the favorite type of pizza that 7th graders eat. The data is analyzed taken from a survey that focuses on the toppings of the pizza and not the brand. Students practice the sampling...
Curated OER
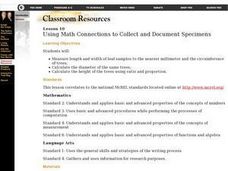
Using Math Concepts to Collect and Document Specimens
Students determine the length and width of leaf samples to the nearest millimeter and the circumference of trees. They participate in a discussion about the importance of collecting specimens carefully. They compile accurate...
Curated OER
Dating Practices
Students interpolate, extrapolate, and make predictions from given information. They present results and conclusions from given data using basic statistics. Pupils create a survey from a critical question and decide which sampling...
Curated OER
Earth Day Trash Survey Unit
Students develop a questionnaire to distribute via e-mail or Web page forms that visitors fill out based on the data they gathered during their clean-up activities.
Curated OER
How Do You Spend Your Time?
Students keep records and determine how much time they spend on certain activities. They insert the data into a spreadsheet. Students graphically display data in a bar graph and a circle graph.
Curated OER
Probability Plus
Students participate in a variety of activities to understand statistics. They collect and interpret data. Also students distinguish the difference between a population and a sample. They make inferences and create arguments using data.
Curated OER
Replanting the Rainforest
Young scholars practice problem solving techniques. They interpret data gathered by student researchers in Australia about the effectiveness of various strategies for controlling weed growth in a newly replanted rainforest.
EngageNY
The Concept of a Function
Explore functions with non-constant rates of change. The first installment of a 12-part module teaches young mathematicians about the concept of a function. They investigate instances where functions do not have a constant rate of change.
Noyce Foundation
Baseball Players
Baseball is all about statistics. Pupils solve problems related to mean, median, and range. They calculate the total weight of players given the mean weight, calculate the mean weight of reserve players given the mean weight of the...
Curated OER
Plotting with Pennies
Fifth graders use pennies to gather data, organize and order data, graph the data on a stem-and-leaf plot, and evaluate the range, median, and mode of the data.
Curated OER
Using Active Learning to Reinforce Mathematics
Students predict, then measure how far a bug can travel on a "course" over a specified amount of time, then construct graphs based on the data they acquire.
Curated OER
Investigating Volume
Ninth graders investigate and make conjectures about volume. In this geometry lesson, 9th graders analyze data and predict the outcome. They calculate volume using different tiers.
Curated OER
Volume of a Cylinder
Middle and high schoolers calculate the volume of cylinders. They measure the height, radius and diameter of cylinders. Following given formulas, students calculate the area and volume of the cylinder. They compare cylinders and predict...

