Illustrative Mathematics
Mile High
What is the meaning of sea level? This resource helps your class understand the meaning of elevations above, below, and at sea level. Provides for good discussion on using positive and negative numbers to represent quantities in the real...
National Security Agency
Classifying Triangles
Building on young mathematicians' prior knowledge of three-sided shapes, this lesson series explores the defining characteristics of different types of triangles. Starting with a shared reading of the children's book The Greedy...
EngageNY
Real-World Positive and Negative Numbers and Zero
Class members investigate how positive and negative numbers are useful in the real world. Individuals first read a short passage and identify terms indicating positive and negative numbers. They consider situations involving positive...
Achieve
Greenhouse Management
Who knew running a greenhouse required so much math? Amaze future mathematicians and farmers with the amount of unit conversions, ratio and proportional reasoning, and geometric applications involved by having them complete the...
Achieve
Yogurt Packaging
Food companies understand how to use math to their advantage. Learners explore the math related to the packaging and serving size of yogurt. They then use unit analysis and percent values to make decisions on the product development.
Illustrative Mathematics
Weather Graph Data
Teaching young mathematicians about collecting and analyzing data allows for a variety of fun and engaging activities. Here, children observe the weather every day for a month, recording their observations in the form of a bar graph....
Concord Consortium
Acid Test
This isn't your typical basic lesson—it's more acidic! Learners use pH information to determine the hydroxide ion concentration of different substances and then use these values to analyze information. The calculations require...
EngageNY
Comparing Distributions
Data distributions can be compared in terms of center, variability, and shape. Two exploratory challenges present data in two different displays to compare. The displays of histograms and box plots require different comparisons based...
Achieve
False Positives
The test may say you have cancer, but sometimes the test is wrong. The provided task asks learners to analyze cancer statistics for a fictitious town. Given the rate of false positives, they interpret the meaning of this value in the...
Concord Consortium
Vending Machine
Let the resource quench your thirst for knowledge, like a vending machine that dispenses drinks. Future computer scientists develop an algorithm to identify the fewest number of coins that a vending machine could use in creating change....
Teach Engineering
Applications of Linear Functions
It's not so straightforward — lines can model a variety of applications. Pupils experience linear relationships within the context of science, including Hooke's and Ohm's Laws. Class members got a taste of motion and speed from the...
Illustrative Mathematics
Archimedes and the King's Crown
Learners will shout "Eureka!" in this quick but deep activity replicating the famous bathtub experiment of Archimedes. Given the scenario of a king with a suspected fake crown, young investigators develop formulas using density to...
Annenberg Foundation
Geometry 3D Shapes: Test Your Skills
Time to find out what they've learned! The final lesson of a five-part series has learners complete a 39-question multiple choice review. They use what they've learned in the previous lessons to complete questions that include concepts...
Illustrative Mathematics
Grass Seedlings
Plants never grow at the same rate, and that is the antithesis for this word problem involving multiplication of fractions. On the worksheet, Raul notices that Pablo's seedlings are 1 1/2 times as tall, and Celina's seedlings are 3/4 as...
Illustrative Mathematics
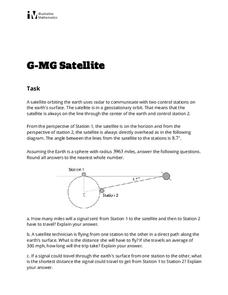
Satellite
Learners practice relating rules of trigonometry and properties of circles. With a few simplifying assumptions such as a perfectly round earth, young mathematicians calculate the lengths of various paths between satellite and...
Illustrative Mathematics
US Garbage, Version 1
An interesting example of a discrete function and how it is applies to the real world. This could easily make a good collaborative activity with an environmental science class. Practice reading a table and drawing a scatter plot make up...
Illustrative Mathematics
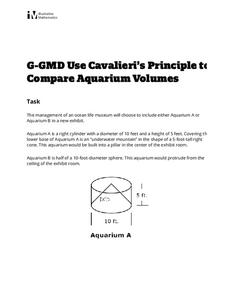
Use Cavalieri’s Principle to Compare Aquarium Volumes
Learners are designing a stunning new water feature for an aquarium, but they soon discover that more than just a pretty home for their fishy friends is required. From calculating the volume of a composite shape through the...
Curated OER
Delayed Gratification
Word problems are great for engaging critical thinking skills, and word problems involving money increase a child's financial literacy. Boost your critical and financial thinkers with a multi-step word problem involving money and problem...
Curated OER
Dental Impressions
What an impressive task it is to make dental impressions! Pupils learn how dentists use proportional reasoning, unit conversions, and systems of equations to estimate the materials needed to make stone models of dental impressions....
Shodor Education Foundation
Algebra Quiz
Reviewing the process of solving equations is as easy as one click of a button. Scholars solve linear and quadratic equations by using a helpful interactive. The computer app automatically scores responses, providing immediate feedback...
Georgia Department of Education
Analytic Geometry Study Guide
Are you looking for a comprehensive review that addresses the Common Core standards for geometry? This is it! Instruction and practice problems built specifically for standards are included. The material includes geometry topics from...
CPALMS
Writing an Exponential Function from its Graph
Grow an equation for the exponential graph. Given a graph of an exponential function, class members write the equation of the function provided. The graph labels two points on the graph: the y-intercept and the point where x is one.
Concord Consortium
Gestation and Longevity
Is the gestation length of an animal a predictor of the average life expectancy of that animal? Learners analyze similar data for more than 50 different animals. They choose a data display and draw conclusions from their graphs.
California Education Partners
Lashelles Garden
Let knowledge grow bountifully like plants in a garden. Given a diagram of a rectangular garden split into plots, scholars determine the area of the entire garden and the areas of the individual plots. As a culminating activity, they...


