Shodor Education Foundation
Vertical Line Test
Connect the points to create a function. Using points given by the applet, pupils try to connect them to create a line that would pass the vertical line test. The resource keeps track of the number of sets the learner is able to identify...
Shodor Education Foundation
Two Variable Function Pump
Use a function to operate on two variables. Pupils look at operating with complex numbers as a function of two variables. The interactive squares the input and adds a constant to it. Learners visualize the resulting output and its...
Shodor Education Foundation
Simple Maze Game
Avoid the mines and win the game! Young scholars direct a robot through a minefield by plotting points. Their goal is to reach the target in as few moves as possible.
Curated OER
Butterfly Addition: Color by Numbers
Children learning to add numbers up to 11 develop the strategy of using the larger number as the first addend and counting on from there to find a sum. They define addition and review the meaning of the plus (+) symbol. To practice, they...
Curated OER
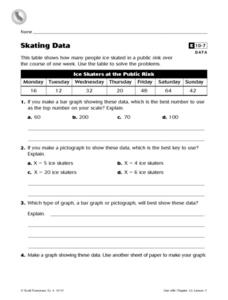
Skating Data
In this collecting data activity, 4th graders view a table on ice skaters at a public rink in order to answer 2 multiple choice questions, 1 short answer question and make a graph showing one piece of the data.
Curated OER
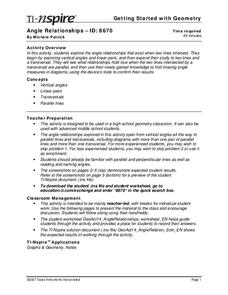
Angle Relationships
Tenth graders explore the angle relationships that exist when two lines intersect. In this geometry lesson, 10th graders estimate the measure of given angles and use their graphing calculator tools. Students use this knowledge to find...
Curated OER
Chances And Tallying
In this graphing worksheet, 2nd graders use tally marks for a coin toss. Students respond to 5 questions about their chart and outcomes.
Mathematics Vision Project
Module 1: Functions and Their Inverses
Undo a function to create a new one. The inverse of a function does just that. An inquiry-based lesson examines the result of reversing the variables of a function, beginning with linear patterns and advancing to quadratic and...
Shodor Education Foundation
Box Plot
What information can come from a box? Learners choose a data set to display as a box plot and decide whether to include the median in the calculation of the quartiles, show the outliers, and change the scale. To finish the lesson,...
Shodor Education Foundation
Regression
How good is the fit? Using an interactive, classmates create a scatter plot of bivariate data and fit their own lines of best fit. The applet allows pupils to display the regression line along with the correlation coefficient. As a final...
Shodor Education Foundation
Skew Distribution
Slide the class into a skewed view. Learners alter the location of the median relative to the mean of a normal curve to create a skew distribution. They compare the curve to a histogram distribution with the same skewness.
Shodor Education Foundation
Multiple Linear Regression
You'll have no regrets when you use the perfect lesson to teach regression! An interactive resource has individuals manipulate the slope and y-intercept of a line to match a set of data. Learners practice data sets with both positive and...
Curated OER
How Do You Rate?
Fifth graders make a graph. In this pulse rate lesson, 5th graders estimate their pulse and record it. Students measure their pulse while at rest and after physical activity and record it. Students use the internet to graph their results...
Curated OER
Bias in Statistics
Students work to develop surveys and collect data. They display the data using circle graphs, histograms, box and whisker plots, and scatter plots. Students use multimedia tools to develop a visual presentation to display their data.
Curated OER
Checking Test Comparability/Scattergrams
Students construct a scattergram graph. In this statistics lesson plan, students graph data by hand and using a spreadsheet program. They establish lines of best fit and draw conclusions using their graphs.
Curated OER
Teaching with Collections
Learners examine collections. In these real-world collections lessons, students examine and describe buttons and shells. Learners will then sort, classify, and graph items according to various indicated descriptors.
Curated OER
Double Data
In this data worksheet, students answer 4 questions about a double line graph. For example, "How can you use the graph to figure out when each alligator grew the most?"
Curated OER
Classy Fractions
In this fractions worksheet, students find the total numbers of students in their class and ask each student 7 questions provided. Students make a tally chart to record the responses and calculate the fraction of the class that answered...
Curated OER
Apples and Apple Activities
Learners investigate apples. In this reading comprehension instructional activity, students read a book about apples then compare and contrast, make graphs, distinguish between fact and fiction and work in groups. Learners...
Curated OER
Immigration and Citizenship
Students make graphs showing Canada's immigration patterns over time. Then students play the role of an immigrant seeking citizenship and perform a mock citizenship ceremony.
Curated OER
Make a Pictograph
In this pictograph activity, 2nd graders create a pictograph involving colors they see the most often in clothing, recording marks and placing those marks in three boxes labeled red, blue and green. Students cut out squares for each 5...
Curated OER
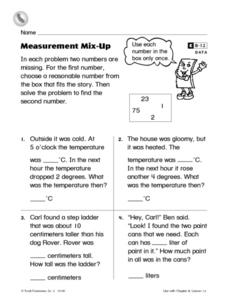
Measurement Mix-Up
In this measurement worksheet, 2nd graders read 4 word problems and find the two numbers missing in each one. Students choose a reasonable number from the box that fits the story for the first number and then solve the problem to find...
Curated OER
Picture This
In this shapes worksheet, 2nd graders look at 9 lettered pictures within a grid and copy each shape in the correct lettered box in the second grid. Students write down what they see in a complete sentence.
Curated OER
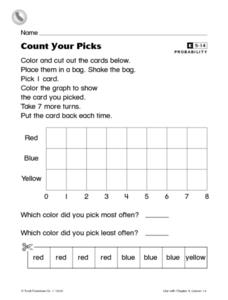
Count Your Picks
In this probability worksheet, students cut out 3 color cards and place them in a bag. Students pick a card out of the bag 8 times, putting the card back each time. Students record their results on a bar graph.


