Illustrative Mathematics
Which Weighs More? Which Weighs Less?
Expand the the comparative language of young mathematicians with a hand-on weight measurement activity. Working independently or in pairs, children compare the weight of large wooden blocks to various other classroom objects, recording...
Curated OER
Using Algebra Tiles to Explore Distributive Property
Math is fun with algebra tiles! Young mathematicians explore eight expressions involving the distributive property and use algebra tiles to expand simple expressions. The resource is perfect for both guided and independent practice.
Little White Bear Studios
TanZen - Relaxing Tangram Puzzles
An ancient puzzle game meets a modern implementation. Challenge mathematicians of all ages with this mind-bending geometric puzzle game.
Illustrative Mathematics
Heads or Tails
Heads! A great way to practice probability is to flip a coin in class. The provided data allows your mathematicians to predict the probability of heads in ten coin flips. Bring coins to class and allow your own trial of heads or tails....
Curated OER
Math with Character
Students write math sentences to fit a given story. They recognize number families and discuss the character traits of a sharing and relate their feeelings and experience with sharing. The Doorbell Rang story is read and the students...
Curated OER
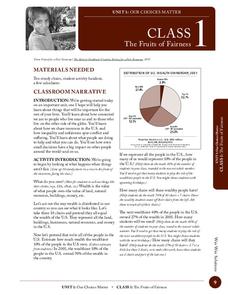
The Fruits of Fairness
Students examine the distribution of wealth in the US. In this economic distribution lesson, students use math skills to apply real statistics to the students in their classroom making these facts more of a reality.
Curated OER
Three Division Games
In this division games learning exercise, learners play games of "cut and choose," last diminisher and sealed bids. Instructions for each game are given and are designed so that fair share is always won in spite or irrational playing.
Curated OER
Gifts from Grandma, Variation 1
Composed of three word problems, this math activity exposes young mathematicians to relationships present in multiplication and division. The first problem is most useful with a tape diagram in which learners are working with equal-sized...
Curated OER
School Advisory Panel
How would you choose three students from your class to be on a school panel that would represent a fair and representative view of opinions? This brief activity offers four different sampling methods to choose from and asks for...
Curated OER
Problem Solving - Draw a Diagram
There is an excellent strategy for learners to use when faced with a word problem that uses fractions. This presentation shows how to draw a diagram of the fractions in the problem in order to get a visual representation. Although brief,...
Curated OER
The Gingerbread Man - Cutting in Half
Students use the gingerbread man that they made earlier in the day. They demonstrate how to cut the gingerbread man in half, leaving two fair shares or two pieces the same. The gingerbread man pattern is imbedded in an attached file in...
Curated OER
Understanding Rational Numbers and Proportions
Students explore parts of a whole. In this fraction lesson, students determine what makes a fair share. Working with manipulatives, students solve mathematical problems containing fractions.
Curated OER
Division Word Problems: Split The Bill
In this division worksheet, students solve a total of 7 problems. All problems ask students to "split a bill" between a number of people. Answers are included on page 2.
Curated OER
One-Variable Inequality Word Problems
Here is a great set of eight scenarios that require the writing of a one-variable inequality and then solving to find the solution. This inequality word problem activity is then followed by the solutions to each of the eight problems.
American Statistical Association
Chocolicious
To understand how biased data is misleading, learners analyze survey data and graphical representations. They use that information to design their own plans to collect information on consumer thoughts about Chocolicious cereal.
Curated OER
Playing with Remainders
Fifth graders explore how people handle remainders in real life. In this remainders math lesson, 5th graders participate in skits to show what to do with remainders. Students complete worksheets with word problems.
Curated OER
Dividing by 4's
Third graders explore math functions by completing problem solving activities. In this division lesson, 3rd graders utilize the division strategies acquired earlier to divide multiple digit numbers by 4's. Students complete problems on...
Curated OER
Fair-division
In this division instructional activity, students complete word problems with division about pizza slices, jelly servings, percentages of cards, and more. Students complete 14 problems.
Virginia Department of Education
Balancing Act
How many different interpretations of the mean are there? Scholars place numbers on a number line and determine the mean. They interpret the mean as the average value and as the balance point.
Charleston School District
Scientific Notation Operations
How do you operate with numbers in scientific notation? The resource provides examples on how to divide and multiply with numbers written in scientific notation. The handout and video also cover the procedure for addition and subtraction...
Curated OER
Values
Fifth graders participate in a class auction to determine their values. In this health and math lesson, 5th graders list the top ten most important things in their lives, then the teacher introduces the idea of a values auction. Students...
Curated OER
Least Common Multiple
Give students detailed instructions on how to find the Least Common Multiple as well as practice with this thorough introductory worksheet. Instructions for this worksheet include an explanation of both guess and check as well as prime...
Curated OER
Division
Students complete division activities using the concept of sharing equally. In this division instructional activity, students discuss division using equal piles. Students receive sets of candy and determine if the example were fair....
Curated OER
Bar and Histograms (What Would You Use: Part 1)
Students practice creating bar graphs using a given set of data. Using the same data, they create a group frequency chart and histograms. They must decide the best graph for the given set of data. They share their graphs with the...


