Curated OER
Human Activity and the Environment
Students review and analyze graphs and tables as a group. They develop their graph and data analysis skills by converting data tables from Human Activity and the Environment into graphs.
Curated OER
Walking on Air
Students collect and analyze data with a graph. In this statistics lesson, students use central tendencies to find the meaning of their data. They display the data on a Ti calculator.
Curated OER
Graphing on a Coordinate Plane
Eighth graders explore the coordinate system. They identify the x and y-axis, parts of the coordinate plane, and discuss the process of plotting points. To emphasize the process of plotting points, 8th graders play an ordered pair...
Ms. Amber Nakamura's Mathematics Website
Algebra Project
What would your dream house look like? A cottage? A medieval castle? High schoolers enrolled in Algebra design the perfect house while using slopes to write equations for various aspects of the project.
Virginia Department of Education
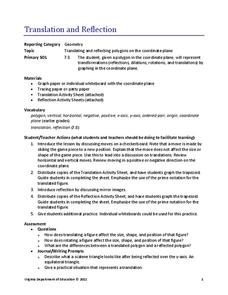
Translation and Reflection
Bring about the change you want to see in the world or at least in your lesson plans. Young mathematicians learn about translation and reflections by applying them to polygons on the coordinate plane. Results provide data to...
Virginia Department of Education
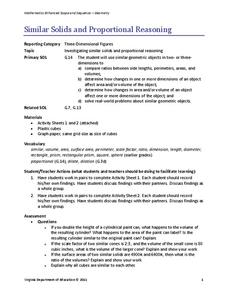
Similar Solids and Proportional Reasoning
Double the dimensions, quadruple the surface area. Pairs build similar prisms and compare the ratios of their surface areas and volumes to the ratio of the heights. Given two similar cones, partners determine the ratios of the lateral...
National Security Agency
Systems of Equations and Inequalities
High school classes can use manipulatives too! Offer hands-on, interactive lessons that venture away from the typical day in your algebra class. Young mathematicians will be involved in collaborative learning, visual...
West Contra Costa Unified School District
Correlation and Line of Best Fit
Computers are useful for more than just surfing the Internet. Pupils first investigate scatter plots and estimate correlation coefficients. Next, they use Microsoft Excel to create scatter plots and determine correlation...
National Security Agency
Multiple Representations of Limits
After an introductory activity to demonstrate the theory of a limit, additional activities approach a limit from graphical, numerical, and algebraic methods. The activity looks at the multiple ways of understanding and evaluating a...
Fort Bend Independent School District
Data Analysis - AP Statistics
What better way to study survey design than to design your own survey! Bring a versatile data analysis project to your AP Statistics class, and encourage them to apply the practices from their instructions to a real-world survey...
EngageNY
Perimeter and Area of Triangles in the Cartesian Plane
Pupils figure out how to be resourceful when tasked with finding the area of a triangle knowing nothing but its endpoints. Beginning by exploring and decomposing a triangle, learners find the perimeter and area of a triangle. They...
Mathematics Assessment Project
College and Career Readiness Mathematics Test B2
Use a nine-page evaluation to cover material from algebra, geometry, and algebra II. It incorporates short answer, applied reasoning, and conversion problems.
American Statistical Association
Bear Hugs
Scholars research arm span to determine who gives the best bear hugs. They use data from a national study to find the standard statistics for arm span. It includes mean, median, quartiles, spread, standard deviation, and more.
American Statistical Association
You and Michael
Investigate the relationship between height and arm span. Young statisticians measure the heights and arm spans of each class member and create a scatter plot using the data. They draw a line of best fit and use its slope to explain the...
EngageNY
Scale Factors
Is it bigger, or is it smaller—or maybe it's the same size? Individuals learn to describe enlargements and reductions and quantify the result. Lesson five in the series connects the creation of a dilated image to the result. Pupils...
California Education Partners
Cady's Cats
How much can a cat eat? The five-question fraction assessment asks pupils to determine the fractional portion of a food box eaten by cats. Learners show their proficiency in adding and subtracting fractions using several scenarios...
EngageNY
How Do Dilations Map Segments?
Do you view proofs as an essential geometric skill? The resource builds on an understanding of dilations by proving the Dilation Theorem of Segments. Pupils learn to question and verify rather than make assumptions.
Curated OER
Point Reflection
Use this task as an exit ticket for your eight graders during the geometry unit. All they need to do is identify the coordinates of a point reflected over y=2000.
Balanced Assessment
A Fishy Story
There's nothing fishy about this resource. In the task, learners use given information about fish prices to create a scatter plot and line of best-fit. Later, they use the information to answer questions about the profit from fish sales.
American Statistical Association
Happy Birthday to . . . Two?
How many people do you need in a room before two likely share the same birthday? Scholars consider this puzzle by analyzing a set of data. They ponder how to divide the data and determine the proper size of a group for this event to...
EngageNY
Making Scale Drawings Using the Ratio Method
Is that drawn to scale? Capture the artistry of geometry using the ratio method to create dilations. Mathematicians use a center and ratio to create a scaled drawing. They then use a ruler and protractor to verify measurements.
Education.com
Measure School Supplies
Ever wonder how long a pair of scissors are? Find out with this simple measuring activity in which pupils use the provided ruler to determine the length of four common classroom supplies.
Achieve
Corn and Oats
How much land does a parcel hold? How much fertilizer does it take for a field of corn? Pupils answer these questions and more as they apply ratio reasoning and unit analysis.
California Education Partners
Photos
Why do all sizes of pictures not show the same thing? Class members analyze aspect ratios of various sizes of photos. They determine which sizes have equivalent ratios and figure out why some pictures need to be cropped to fit...


