Curated OER
Graphing Quadratic Equations
Review the form of a quadratic function, and the parabola it creates. Continue on with the whole group to work through a mini-lab, practicing how to graph quadratic equations with one variable. The goal of this lesson is for the group...
Curated OER
Apple Graphing
Do you like apples? Create a taste test for your first and second grade learners. Cut red, green, and yellow apples, and have learners select their favorite. After tasting all of the apples, they collect data and graph the results with...
Curated OER
Graph the Results: Applesauce Taste Test
Students work together to make applesauce following specific directions. They taste each applesauce and graph the results based on the taste test. They also use the internet to create an online graph.
Curated OER
Grade 1: More Land or Water?
First graders listen as the teacher reads a story involving cross-continent traveling. Students collect a random sample by tossing an inflatable globe and recording whether they touch land or water each time they catch the globe in order...
Curated OER
Visualizing and Naming Polygons
A really useful resource contains 116 slides covering basic geometric concepts related to 2-D or plane shapes. Shape properties, translations, reflections, congruence, symmetry, and grid work are all laid out in a comprehensive and...
Education World
Putting Turkey on a Table (or a Graph)
Grateful learners put turkey on a table (or a graph)! Through a creative project they show statistical information about turkey population, production, and consumption. A great Thanksgiving lesson that can be applied at any time to the...
EngageNY
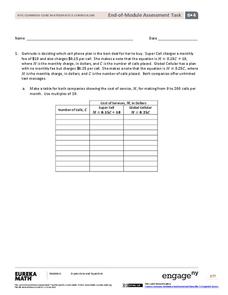
End-of-Module Assessment Task: Grade 8 Module 4
Connect proportional linear equations and systems. The seven-question assessment is the last installment in a 33-part series. The items cover comparing proportional relationships, slope concepts, and simultaneous linear...
EngageNY
End-of-Module Assessment Task: Grade 8 Module 5
Give your class a chance to show how much they've learned in the module with an end-of-module assessment task that covers all topics from the module including linear and non-linear functions and volumes of cones, cylinders, and...
Curated OER
M&M Graphing
Youngsters sort M & M's by color. They graph the M&M's by color on a graph. This classic lesson is a wonderful way to introduce the concept and technique of graphing to young mathematicians. Pairs of kids can make up their own...
Curated OER
"Eggs-ploring" Math with Jellybeans
Learners work in pairs with a small bag of jellybeans to estimate the number of candies in their bags and then figure out how many groups of 10 jellybeans are contained in their bags. They then graph the information using a pictograph or...
Curated OER
Middle Grades Math: Balancing Equations
Learners solve linear equations. By observing the graph of each side of an equation using the TI-nspire graphing calculator, your class gains insight into solutions, as well as balancing equations and transforming linear equations....
Curated OER
Graphs and Equations
In this graphs and equations worksheet, students solve and complete 5 various types of problems. First, they complete a table of values for a given quadratic function. Then, students use the graph to find an estimate for the solutions of...
Curated OER
Making Connections: Matrices, Graph, Linear Systems
In this set of activities, matrices and equations are explored. They work with matrices using pen and paper as well as graphing calculator. Additionally real-world problems are explored.
EngageNY
End-of-Module Assessment Task: Grade 6 Math Module 4
Finish out the module with a bang. The last installment of a 36-part module is an end-of-module assessment task. Test takers set up equations to represent relationships and solve problems in an assortment of contexts.
Utah Education Network (UEN)
Linear Graphs Using Proportions and Rates
Using a TI-73 or other similar graphing calculator middle school math majors investigate the linear relationship of equivalent proportions. After a brief introduction by the teacher, class members participate in a timed pair share...
Curated OER
Compound Inequalities and Graphing
Put geometry skills to the test! Learners solve compound inequalities and then graph the inequalities on a coordinate plane using their geometric skills. They identify the slope and y-intercept in order to graph correctly. I like this...
EngageNY
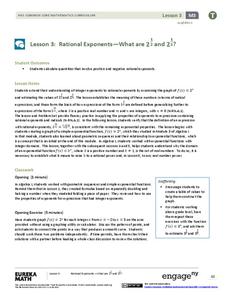
Rational Exponents—What are 2^1/2 and 2^1/3?
Are you rooting for your high schoolers to learn about rational exponents? In the third installment of a 35-part module, pupils first learn the meaning of 2^(1/n) by estimating values on the graph of y = 2^x and by using algebraic...
Curated OER
Representing Data 1: Using Frequency Graphs
Here is a lesson that focuses on the use of frequency graphs to identify a range of measures and makes sense of data in a real-world context as well as constructing frequency graphs given information about the mean, median, and range of...
Inside Mathematics
Expressions
Strive to think outside of the quadrilateral parallelogram. Worksheet includes two problems applying prior knowledge of area and perimeter to parallelograms and trapezoids. The focus is on finding and utilizing the proper formula and...
CCSS Math Activities
Smarter Balanced Sample Items: 8th Grade Math – Claim 3
Communication is the key. A dozen sample items require scholars to communicate their reasoning involved in arriving at a solution. The PowerPoint from the Gr. 8 Claim 2 - 4 Item Slide Shows series uses a variety of content to...
Illustrative Mathematics
Walk-a-thon 1
Your mathematician's job is to explore the relationship between hours and miles walked during a walk-a-thon. The activity compels your learners to experiment with different means in finding out this proportional relationship. The answer...
Curated OER
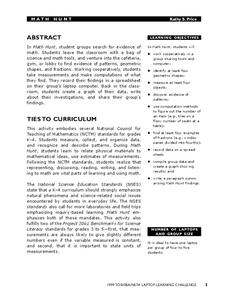
Math Hunt
Go on a scavenger hunt around your school to find evidence of math. Investigate different areas of your school for patterns, fractions, and different geometric shapes. Finally, create a spreadsheet and plot the data you've collected.
EngageNY
Mid-Module Assessment Task: Grade 7 Mathematics Module 3
Lesson 16 in the series of 28 is a mid-module assessment. Learners simplify expressions, write and solve equations, and write and solve inequalities. Most questions begin as word problems adding a critical thinking component to the...
Curated OER
Vacation Values: A Math WebQuest
Fifth graders participate in a Math Web Quest to research two vacation options for their "families" in order to determine the best mathematical value for their family. They gather data, create two comparison graphs based on that data,...


