EngageNY
Representations of a Line
Explore how to graph lines from different pieces of information. Scholars learn to graph linear functions when given an equation, given two points that satisfy the function, and when given the initial value and rate of change. They solve...
EngageNY
More Practice with Box Plots
Don't just think outside of the box — read outside of it! The 15th lesson in a 22-part unit provides pupils more work with box plots. Learners read the box plots to estimate the five-number summary and interpret it within the context....
Virginia Department of Education
Linear Modeling
An inquiry-based algebra activity explores real-world applications of linear functions. Scholars investigate four different situations that can be modeled by linear functions, identifying the rate of change, as well as the...
EngageNY
End-of-Module Assessment Task: Grade 8 Module 1
It's all in the numbers. Determine your pupils' level of understanding of scientific notation using this assessment task. The final lesson in the series assesses scholars on the application of scientific notation in real-life...
Fluence Learning
Solve Problems Using Measurement Concepts
Young mathematicians demonstrate what they know about measurement with a four-task assessment that focuses on estimation, length, and inches.
Scholastic
Study Jams! Estimate Sums & Differences of Whole Numbers
Estimating is an essential skill used in everyday life. This presentation explains how to apply prior knowledge about rounding numbers to estimating sums and differences. Example problems and assessment include large numbers, making this...
Scholastic
Study Jams! Order Whole Numbers
Mia's been practicing for the hundred yard dash and wants to know if she's improving. Help order her race times from greatest to least while learning how to compare numbers using place value. A variety of additional examples are included...
Scholastic
Study Jams! Multiples
Cupcakes and pancakes help teach young mathematicians about multiples in this mouth-watering presentation. Watch and learn how knowing her multiples helps Zoe bake enough desserts for her birthday party. Following the presentation, go...
Scholastic
Study Jams! Mean/Average
Join Zoe as she calculates the average number of points RJ scored in his basketball games. This step-by-step presentation clearly models the procedure for finding the mean of a data set, including examples with both whole number and...
Curated OER
Candy Machine
Using the concept of a candy vending machine, young mathematicians explore the sugar ratios found in different types of candy. Using the provided information, class members calculate and compare different ratios in...
EngageNY
Determining the Equation of a Line Fit to Data
What makes a good best-fit line? In the 10th part of a 16-part module, scholars learn how to analyze trend lines to choose the best fit, and to write equations for best-fit lines to make predictions.
EngageNY
Efficacy of Scientific Notation
How many times could California fit into the entire United States? Pupils use scientific notation to find the answer to that question in the 12th installment of 15 lessons. It asks scholars to write numbers in scientific notation and...
EngageNY
Ordering Integers and Other Rational Numbers II
Individuals build on prior knowledge to order a set of rational numbers from least to greatest or greatest to least. As part of the lesson, they order rational numbers written in different forms.
EngageNY
Comparing Integers and Other Rational Numbers
The ninth installment of a 21-part module has pupils compare integers and rational numbers in decimal and fraction form. They match stories to number lines and compare values in the stories.
EngageNY
Writing and Evaluating Expressions—Multiplication and Addition
How many people can sit around a table? The 22nd part in a series of 36 continues the work on writing and evaluating expressions to include expressions with two operations. Pupils use models to determine an expression for the number of...
EngageNY
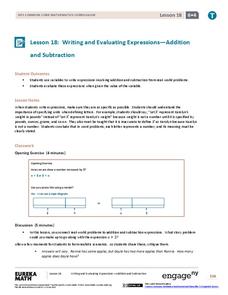
Writing and Evaluating Expressions—Addition and Subtraction
Let Y represent Yes to using an excellent resource. Pupils first learn to define variables using a complete description in the 19th part in a series of 36. They write expressions involving addition and subtraction in real-world...
EngageNY
Describing the Center of a Distribution Using the Median
Find the point that splits the data. The instructional activity presents to scholars the definition of the median through a teacher-led discussion. The pupils use data lists and dot plots to determine the median in sets with even and odd...
EngageNY
Tables of Equivalent Ratios
Don't table the discussion on equivalent ratios — do it now! Scholars create tables of equivalent ratios to represent contextual problems. Pupils go on to use the tables to answer questions within the context. The instructional activity...
Scholastic
Study Jams! Add & Subtract with Common Denominators
RJ and Zoey are at camp and need to get back to the mess hall for lunch, but they don't know how far they have to walk. Help them figure out the distance while teaching young mathematicians how to add and subtract fractions with this...
EngageNY
Solving Basic One-Variable Quadratic Equations
Help pupils to determine whether using square roots is the method of choice when solving quadratic equations by presenting a lesson that begins with a dropped object example and asks for a solution. This introduction to solving by...
Inside Mathematics
Picking Apples
Getting the best pick of the apples depends on where to pick. The short assessment presents a situation in which class members must analyze a real-world situation to determine the cost of picking apples. The pricing structures resemble...
Inside Mathematics
Vencent's Graphs
I like algebra, but graphing is where I draw the line! Worksheet includes three multiple-part questions on interpreting and drawing line graphs. It focuses on the abstract where neither axis has numbers written in, though both are...
EngageNY
Constant Rate
Two-variable equations can express a constant rate situation. The instructional activity presents several constant rate problems. Pupils use the stated constant rate to create a linear equation, find values in a table, and graph the...
EngageNY
Sampling Variability
Work it out — find the average time clients spend at a gym. Pupils use a table of random digits to collect a sample of times fitness buffs are working out. The scholars use their random sample to calculate an estimate of the mean of the...


